I am following very simple trading plan based mainly on RSI and ADX.
Now whenever we wants to initiate trade then firstly we have to decide BIAS for direction.

BIAS based on RSI as follows-
RSI Above 55-Long.
RSI below 45-short.
RSI between 45-55—- neutral.
Continue

Momentum study guides us for exposure in our long or short trade.

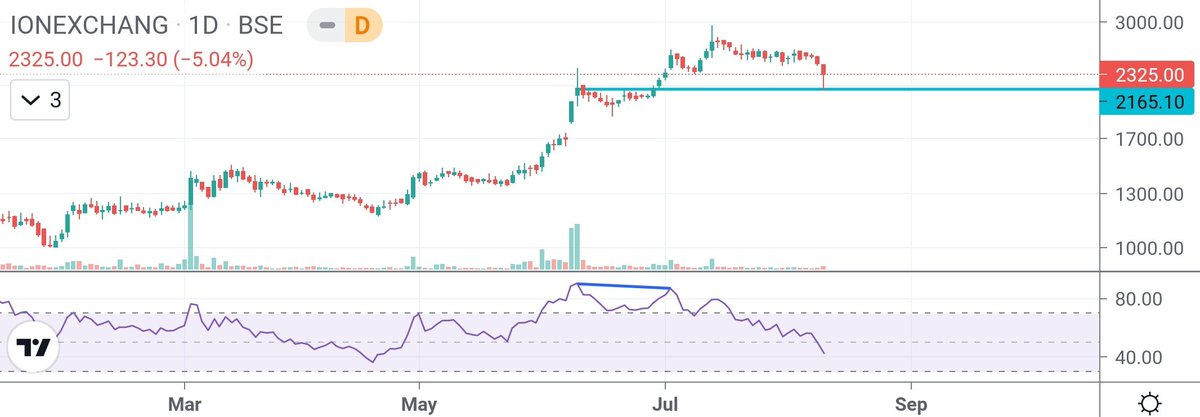
Momentum based on RSI is as follows-
RSI— 55-60~mild long(25%),
RSI— 60-65~moderate long(50%)
RSI— 65-70~strong long (75%)
RSI Above 70~ very strong long (100%)
Momentum based on RSI for short trades is as follows-
RSI— 40-45~mild short (25%),
RSI— 35-40~moderate short (50%)
RSI— 30-35~strong short (75%)
RSI below 30~very strong short (100%).
Please note, one need to check RSI at closing of the day for continuation of trade and exposure.
Now finally trend confirmation.... ADX is very simple and effective tool to judge the underlying is trending or not...whenever adx is rising it gives confirmation of trend formation and when adx crosses 25, it suggests strong trend formation.
When adx is rising and bias is on long side then trend is uptrend.
Similarly with rising adx and short bias gives confirmation of downtrend.
I consider RSI and ADX as pulse and BP measurements of patients....
We doctors can easily manage patients with this two simple time tested parameters.
Same way we can easily manage our trades based on this two simple time parameters of RSI and ADX.
Wish you all happy trading 😄
Let us understand standard deviation range for next expiry based on straddle on expiry day.
At expiry certain players take non directional positions by buying both calls and puts at expiry level means they buy straddle at expiry level.
Certain players do the opposite. Continue..
So by adding or reducing straddle total from expiry level we get important range which I consider as standard deviation range. Buyer of straddle will like to have price above or below this range and seller will like to have in it.
Certain players buy/sell strangle at this range.
So options buyers are sellers create important range for the coming expiry which we need to watch out for taking positions.
I consider that range as standard deviation range. (1SD)
Same way we can get double range which is 2SD.

More from Rsi

You May Also Like

The first ever world map was sketched thousands of years ago by Indian saint
“Ramanujacharya” who simply translated the following verse from Mahabharat and gave the world its real face

In Mahabharat,it is described how 'Maharishi Ved Vyasa' gave away his divine vision to Sanjay


Dhritarashtra's charioteer so that he could describe him the events of the upcoming war.

But, even before questions of war could begin, Dhritarashtra asked him to describe how the world looks like from space.

This is how he described the face of the world:

सुदर्शनं प्रवक्ष्यामि द्वीपं तु कुरुनन्दन। परिमण्डलो महाराज द्वीपोऽसौ चक्रसंस्थितः॥
यथा हि पुरुषः पश्येदादर्शे मुखमात्मनः। एवं सुदर्शनद्वीपो दृश्यते चन्द्रमण्डले॥ द्विरंशे पिप्पलस्तत्र द्विरंशे च शशो महान्।

—वेद व्यास, भीष्म पर्व, महाभारत


Meaning:-

हे कुरुनन्दन ! सुदर्शन नामक यह द्वीप चक्र की भाँति गोलाकार स्थित है, जैसे पुरुष दर्पण में अपना मुख देखता है, उसी प्रकार यह द्वीप चन्द्रमण्डल में दिखायी देता है। इसके दो अंशो मे पीपल और दो अंशो मे विशाल शश (खरगोश) दिखायी देता है।


Meaning: "Just like a man sees his face in the mirror, so does the Earth appears in the Universe. In the first part you see leaves of the Peepal Tree, and in the next part you see a Rabbit."

Based on this shloka, Saint Ramanujacharya sketched out the map, but the world laughed