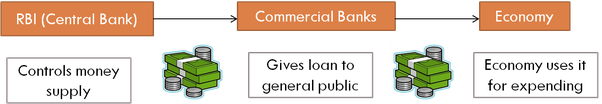
In India, 'RBI' is responsible for 'Monetary Policy' through which it controls 'Inflation' and Economic Growth'.
In this thread, I am going to focus mainly on the role of RBI and how it uses ‘CRR’ and ‘SLR’ as two major tools to control economy. 🧵👇
(1/n)
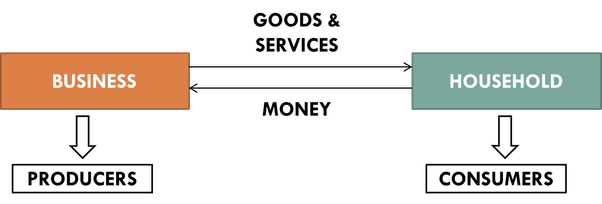
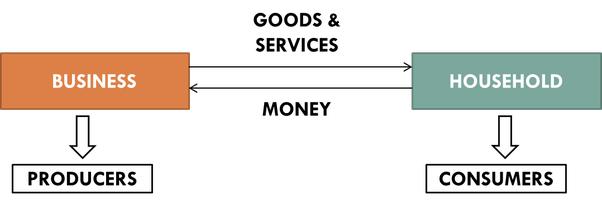
They are the producers of the goods and services. Any business would be happy if it is growing and the prices of the goods and services sold are ever rising. They would be more interested in ‘Economic growth’. (3/n)
These are the people who are consumers and they spend money to buy goods/ services which are sold by the businesses. Any consumer would be happy if the prices of goods/ services are low. Hence, they would be interested in ‘Less Inflation’. (4/n)
It is the job of 'Reserve Bank of India' to do this. (6/n)
A. More the demand of any commodity, the businessman will increase the price. Less the demand of any commodity, the businessman will decrease the price to attract the consumers. (7/n)
More money would cause increase in the purchasing power and hence the demand would increase.
Now, you know that this will cause the price to increase (read point A). (9/n)
Hence, there will be fall in the demand. And fall in the demand will cause the prices to fall (read point A). (10/n)
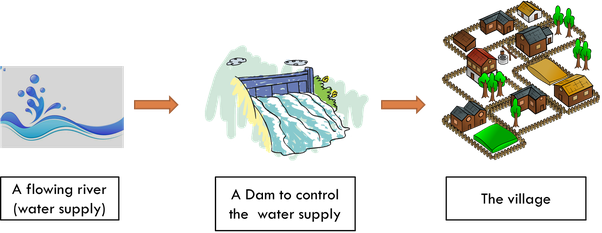
Also, care has to be taken by the engineer as opening all the gates would cause flood like situation in the village. (14/n)
Here, the role of RBI is similar to that of the engineer of the dam. The water supply is akin to the money supply. (16/n)
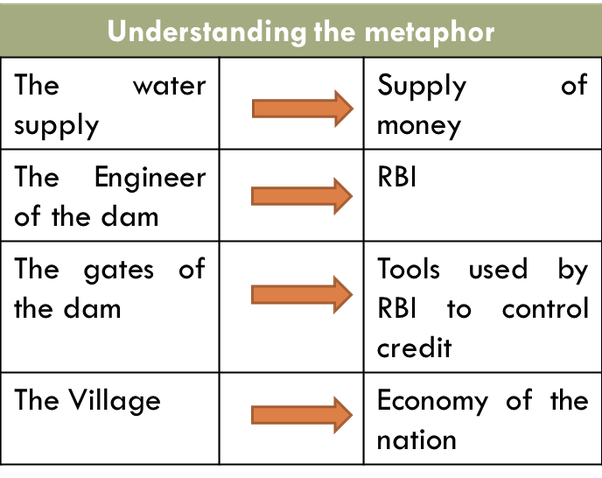
This can be done using various tools. Let us discuss 'CRR' and 'SLR' here. (18/n)
Ravi is a salaried person. He is married and has a 4 year old daughter.
Unfortunately, the daughter meets with an accident and she needs to be operated. (19/n)
“Son, always keep some portion of your salary aside for such unforeseen contingencies.” (20/n)
You see, here father is Reserve Bank of India (RBI) and son is Commercial Bank. (21/n)
This ‘certain portion’ is known as CRR (Cash Reserve Ratio). (22/n)
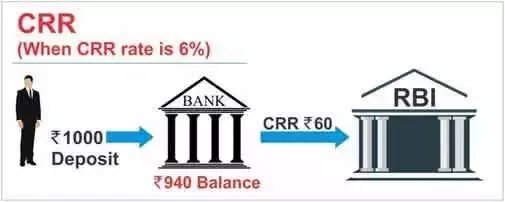
This will lead to lesser money in the economy and hence fall in growth and inflation.
Opposite will happen when RBI decreases CRR. (23/n)
Mr. Sharma loves to eat. Given a chance, he could finish a whole jar of cookies all by himself.
One fine day Mrs. Sharma realises that her husband was getting too fat eating all those unhealthy stuff. (24/n)
Every time Mr.Sharma tried to eat cookies, to his disappointment the jar was locked. (25/n)

However, whenever he followed a healthy schedule, Mrs. Sharma would allow him to cheat and eat those cookies. This was the deal between them. (26/n)
A certain portion of the deposit received by commercial banks from public has to be kept by commercial banks with themselves so that the same reserve could be used in case of future contingencies. (28/n)
This way, RBI is controlling the temptation of commercial banks to lend that portion to public. (29/n)
Whenever need arises, commercial banks can use the amount of SLR as Mr. Sharma was allowed to eat the cookies after following a healthy schedule. (30/n)
Hence Banks would not be able to lend more money.
Lesser money in the hands of public would mean lesser purchasing power.
Decrease in purchasing power would bring down demand and hence reduce the prices. (31/n)
Tagging @Vivek_Investor, @FI_InvestIndia, @datta_arvind for better reach 🙏
More from swapnilkabra


You May Also Like


1/OK, data mystery time.
This New York Times feature shows China with a Gini Index of less than 30, which would make it more equal than Canada, France, or the Netherlands. https://t.co/g3Sv6DZTDE
That's weird. Income inequality in China is legendary.
Let's check this number.
2/The New York Times cites the World Bank's recent report, "Fair Progress? Economic Mobility across Generations Around the World".
The report is available here:
3/The World Bank report has a graph in which it appears to show the same value for China's Gini - under 0.3.
The graph cites the World Development Indicators as its source for the income inequality data.

4/The World Development Indicators are available at the World Bank's website.
Here's the Gini index: https://t.co/MvylQzpX6A
It looks as if the latest estimate for China's Gini is 42.2.
That estimate is from 2012.
5/A Gini of 42.2 would put China in the same neighborhood as the U.S., whose Gini was estimated at 41 in 2013.
I can't find the <30 number anywhere. The only other estimate in the tables for China is from 2008, when it was estimated at 42.8.
This New York Times feature shows China with a Gini Index of less than 30, which would make it more equal than Canada, France, or the Netherlands. https://t.co/g3Sv6DZTDE
That's weird. Income inequality in China is legendary.
Let's check this number.
2/The New York Times cites the World Bank's recent report, "Fair Progress? Economic Mobility across Generations Around the World".
The report is available here:
3/The World Bank report has a graph in which it appears to show the same value for China's Gini - under 0.3.
The graph cites the World Development Indicators as its source for the income inequality data.
4/The World Development Indicators are available at the World Bank's website.
Here's the Gini index: https://t.co/MvylQzpX6A
It looks as if the latest estimate for China's Gini is 42.2.
That estimate is from 2012.
5/A Gini of 42.2 would put China in the same neighborhood as the U.S., whose Gini was estimated at 41 in 2013.
I can't find the <30 number anywhere. The only other estimate in the tables for China is from 2008, when it was estimated at 42.8.