Google Trends covers 17 years of data by now!
✨ Excited to launch:✨
~ WAVES OF INTEREST ~
Tracing Google Search Interest
in US Election Years
https://t.co/iF8VwZTgS7
w/ @recifs @destrysibley @googlenewsinit @albertocairo @smfrogers
🧵👇

Google Trends covers 17 years of data by now!
How did the topic landscape evolve?
And how has the pace of attention shifts changed?
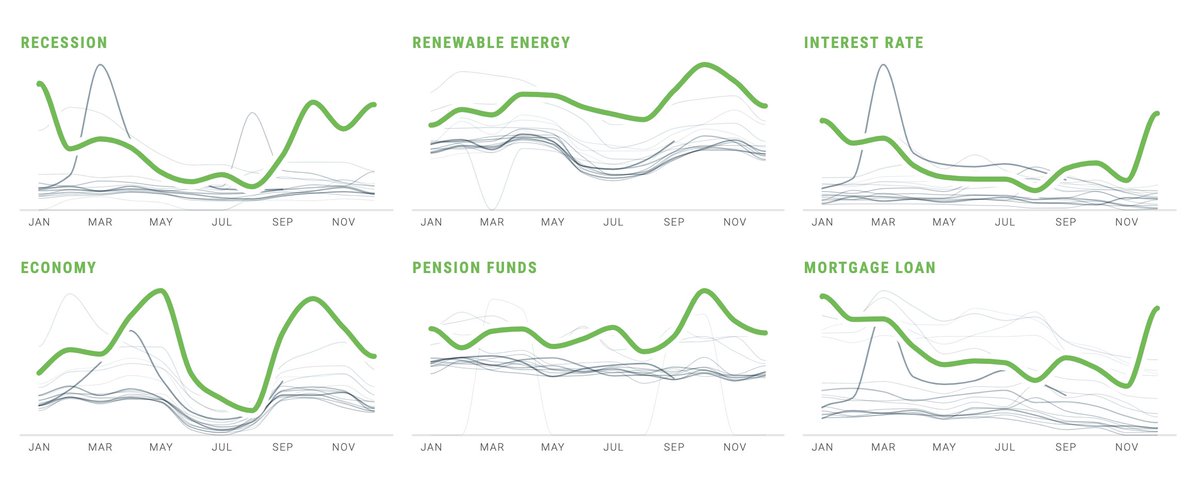
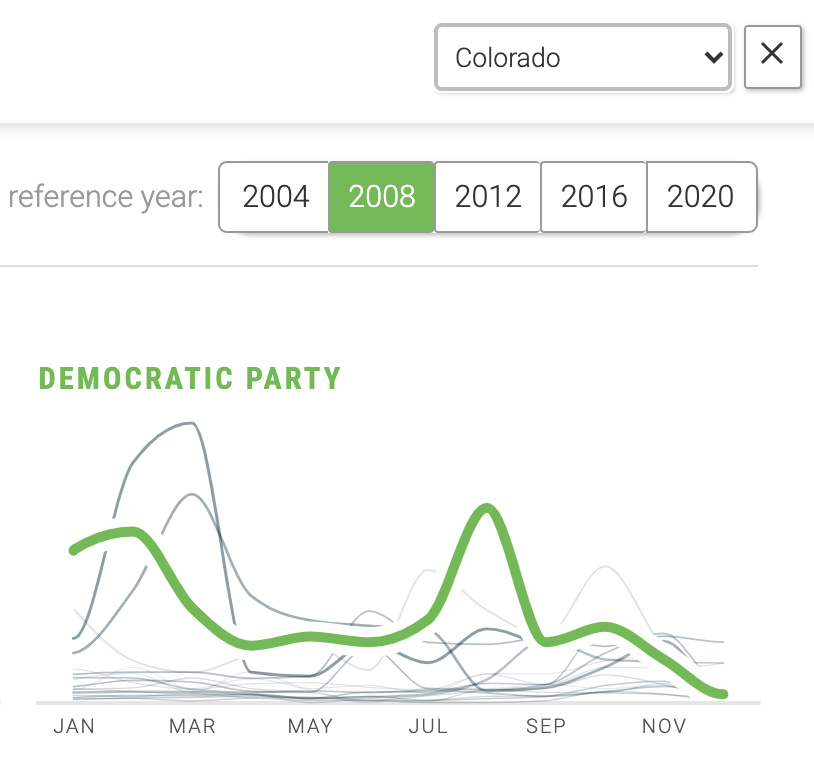
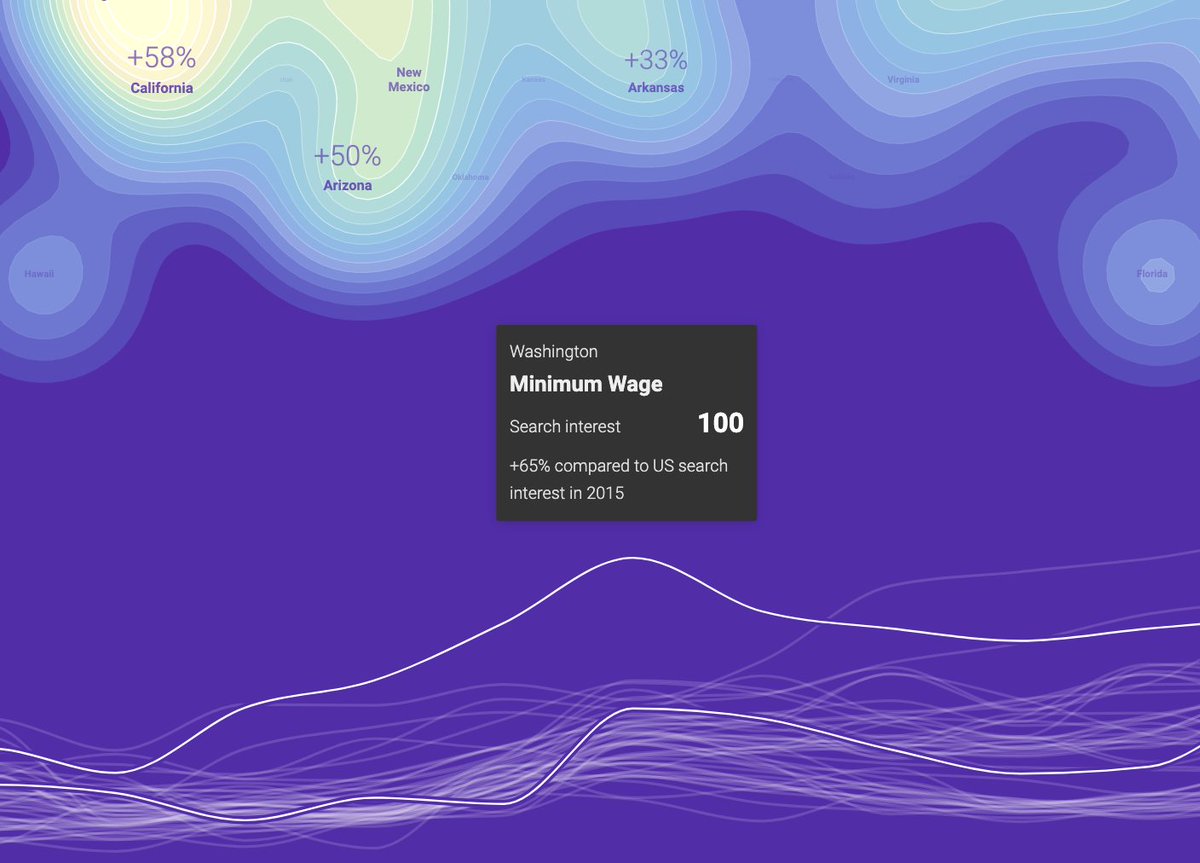
Opening with a smooth wavy line chart animation — an ambient introduction to the theme of waves, and trends — we dive right into the first central question:
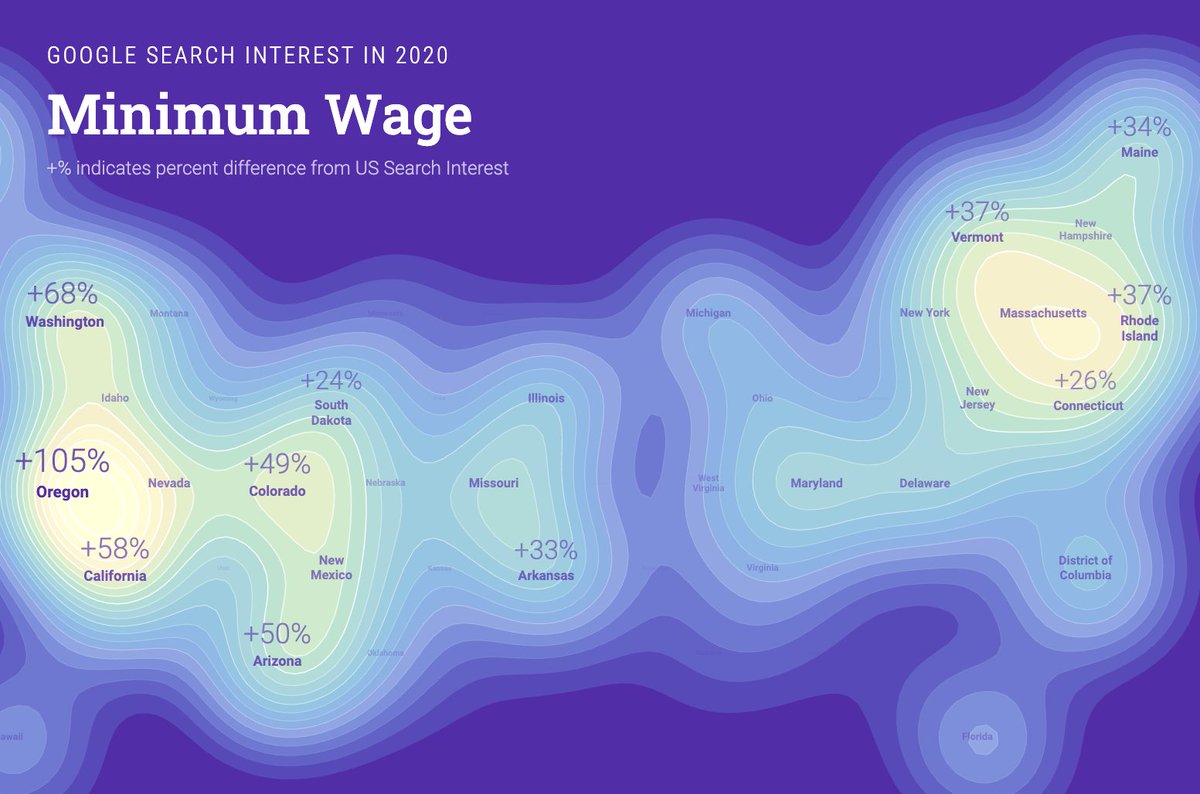
We show both a list of top rising topics in election years, as well as a detailed chart of how their search interest values unfolded over the years.
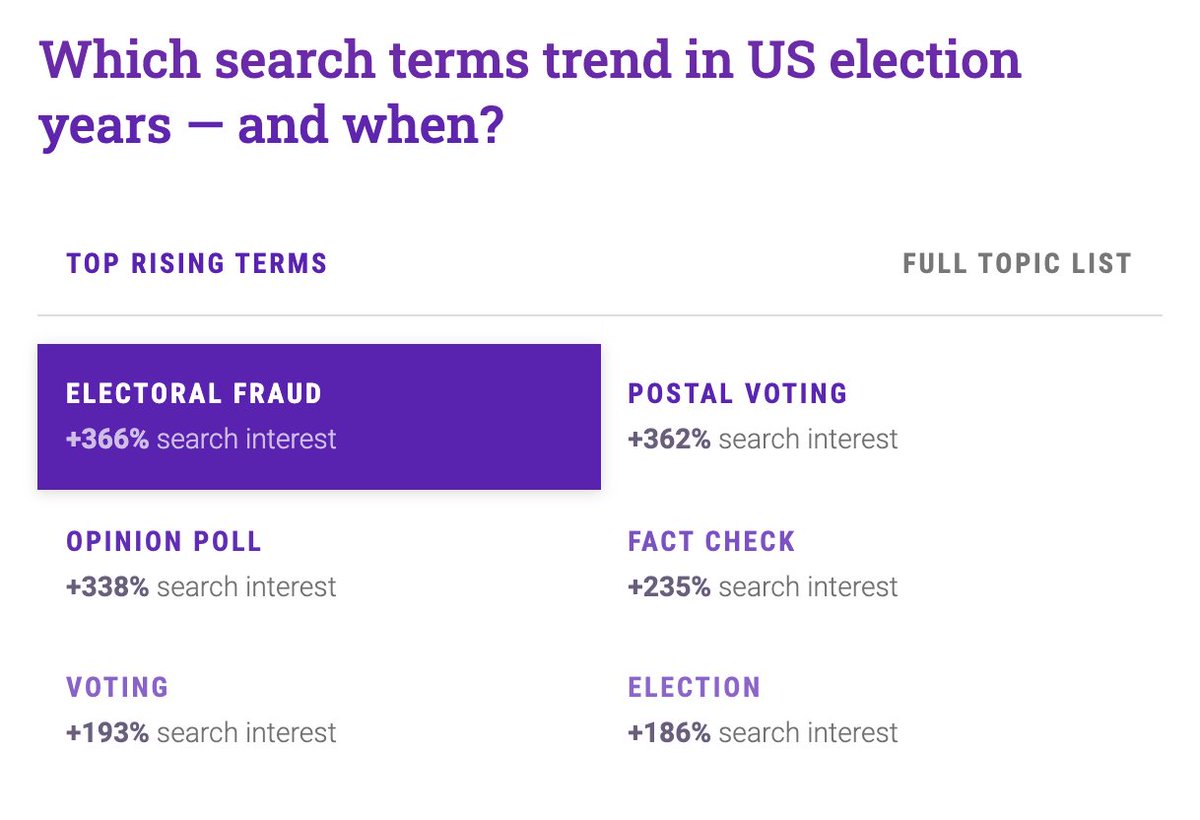
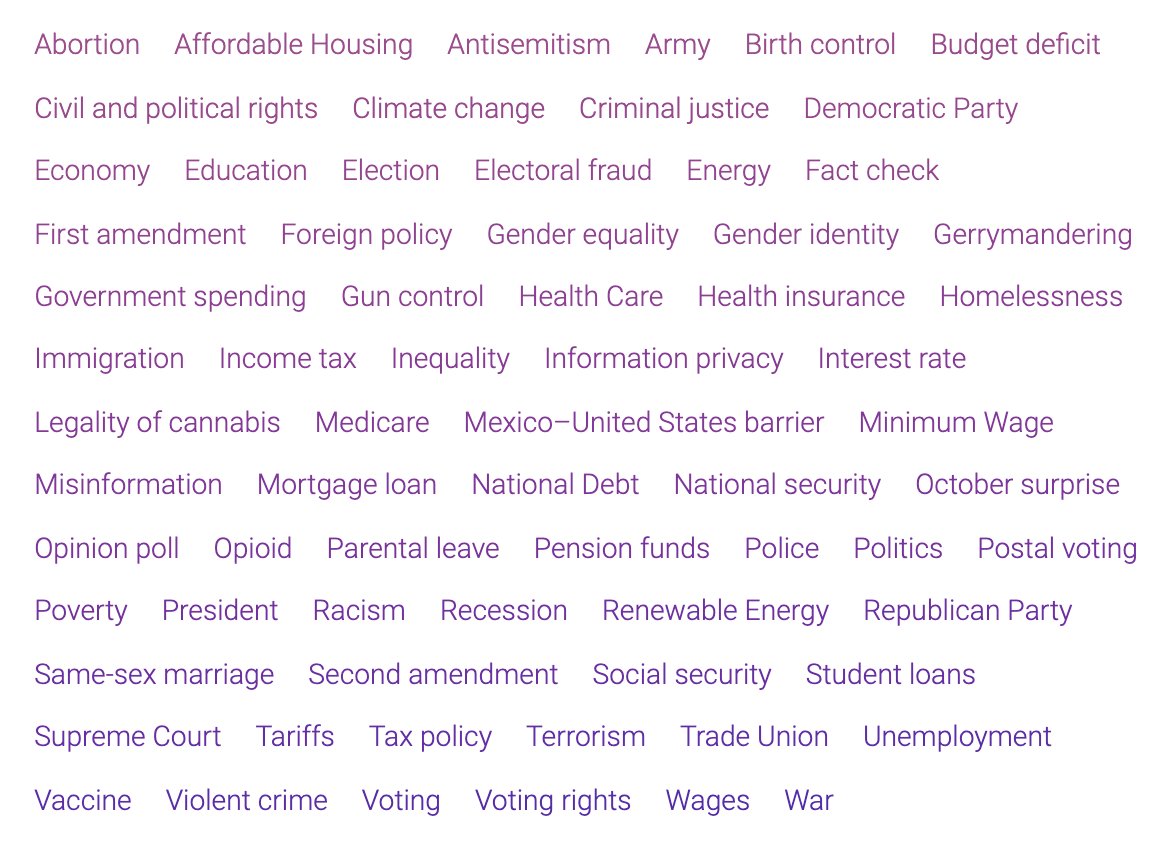
- a set of top searched political terms on Google,
- concepts from Pew surveys on top political issues in election years
- and a few manually added terms to account for recent events.
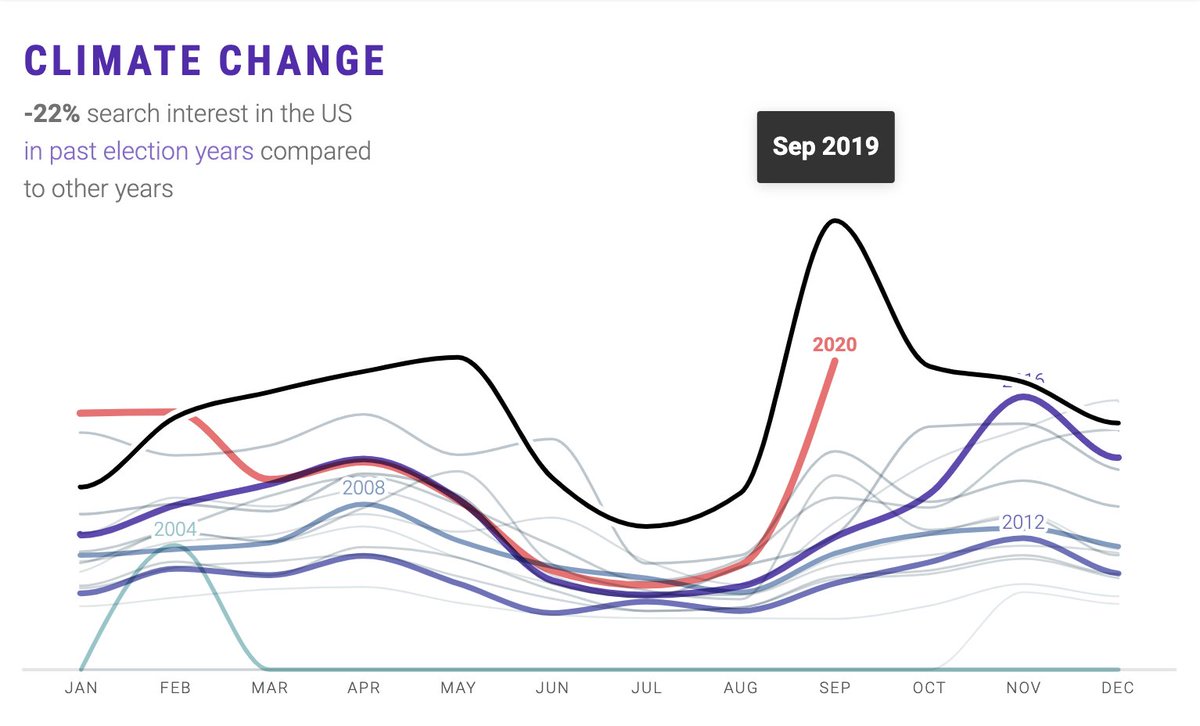
Data says YES INDEED.
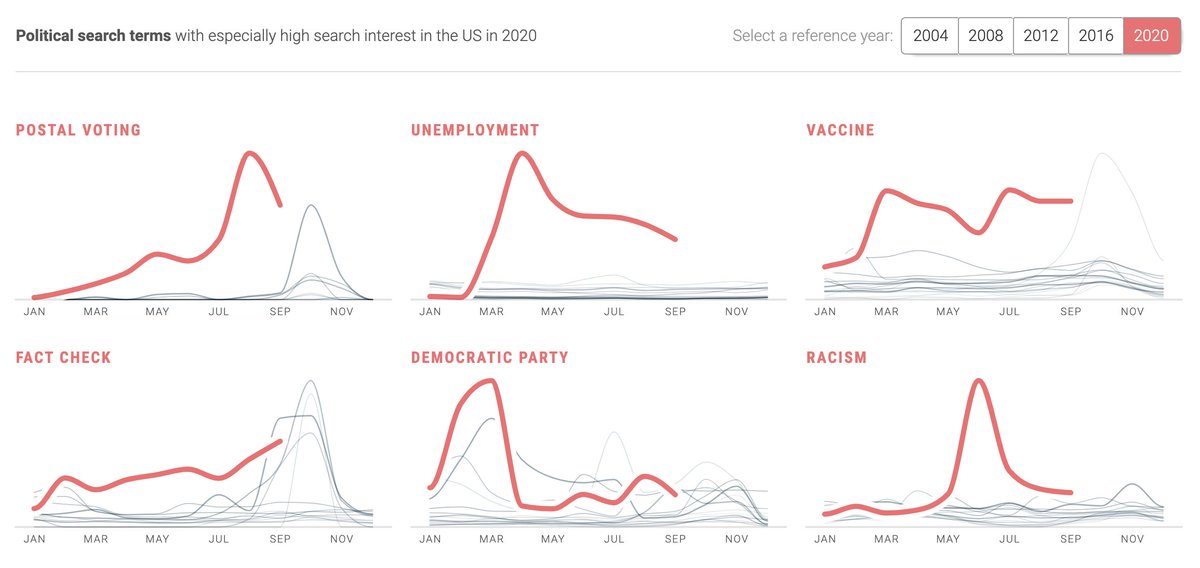
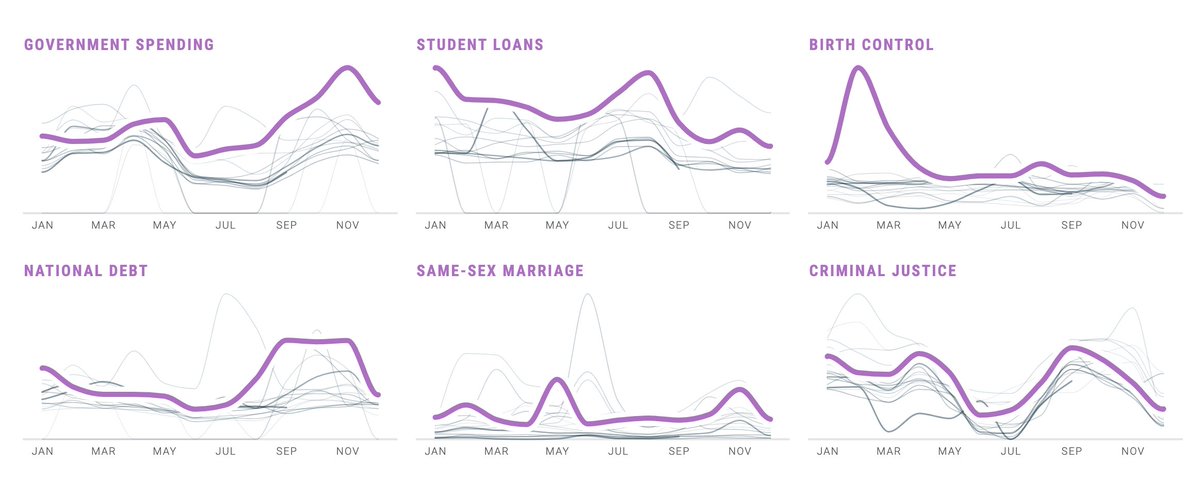
The flatness of these top issue curves, compared to 2020s attention spikiness, tells a striking story how pace of attention shifts has changed dramatically.

https://t.co/7rWPWNLyeL
https://t.co/Mskb1P6n1Z