Google Trends covers 17 years of data by now!
✨ Excited to launch:✨
~ WAVES OF INTEREST ~
Tracing Google Search Interest
in US Election Years
https://t.co/iF8VwZTgS7
w/ @recifs @destrysibley @googlenewsinit @albertocairo @smfrogers
🧵👇

Google Trends covers 17 years of data by now!
How did the topic landscape evolve?
And how has the pace of attention shifts changed?
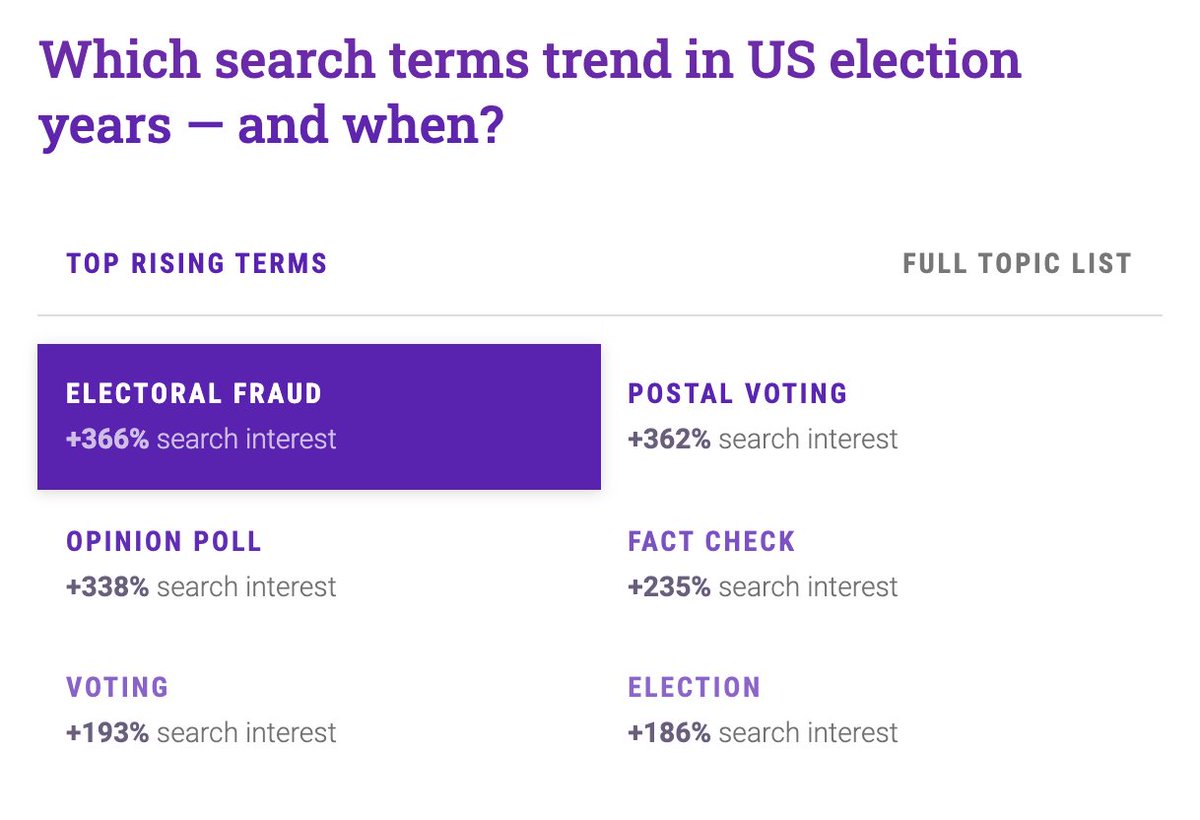
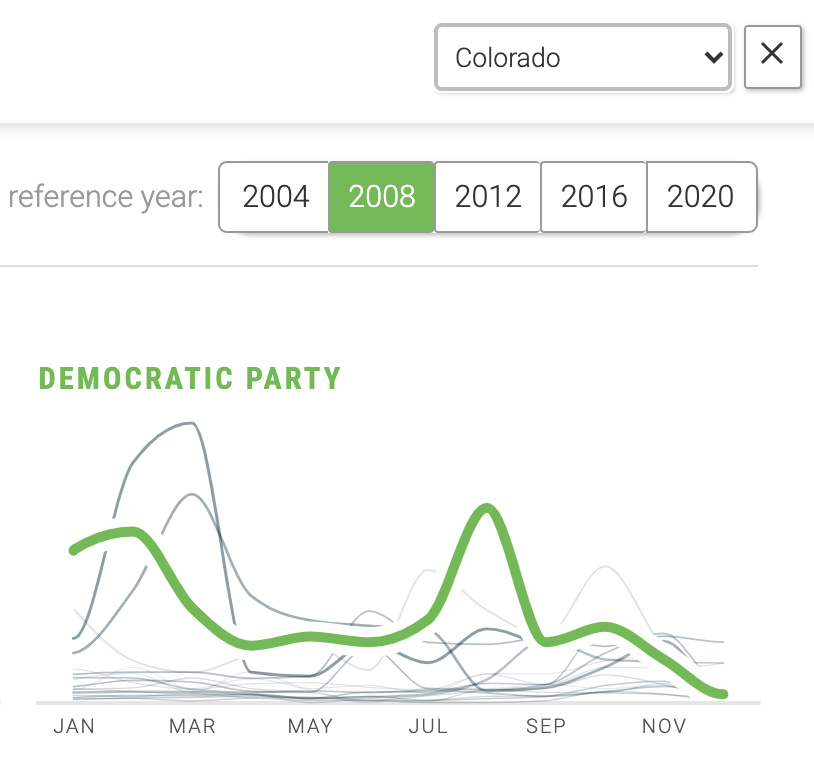
Opening with a smooth wavy line chart animation — an ambient introduction to the theme of waves, and trends — we dive right into the first central question:

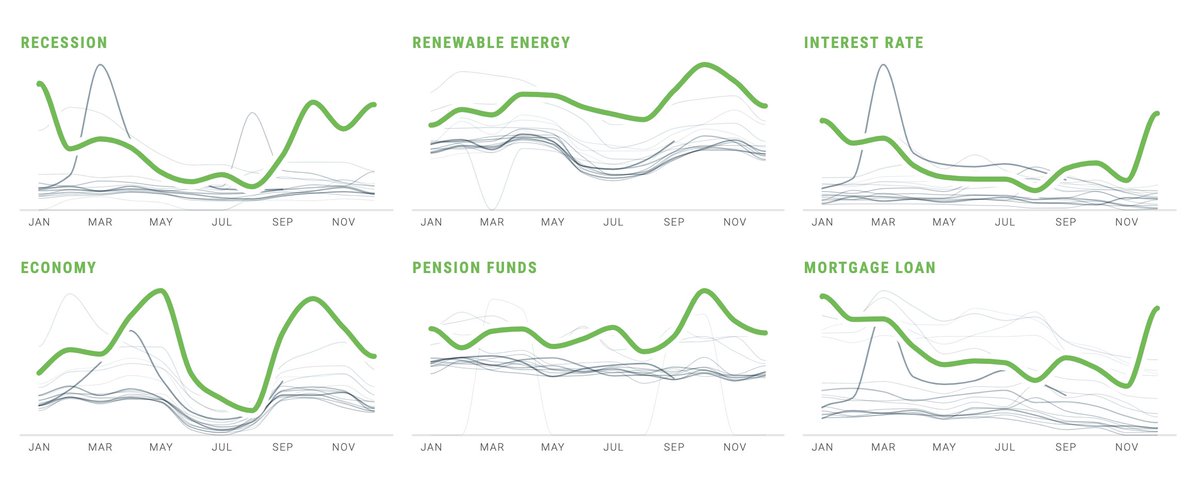
We show both a list of top rising topics in election years, as well as a detailed chart of how their search interest values unfolded over the years.
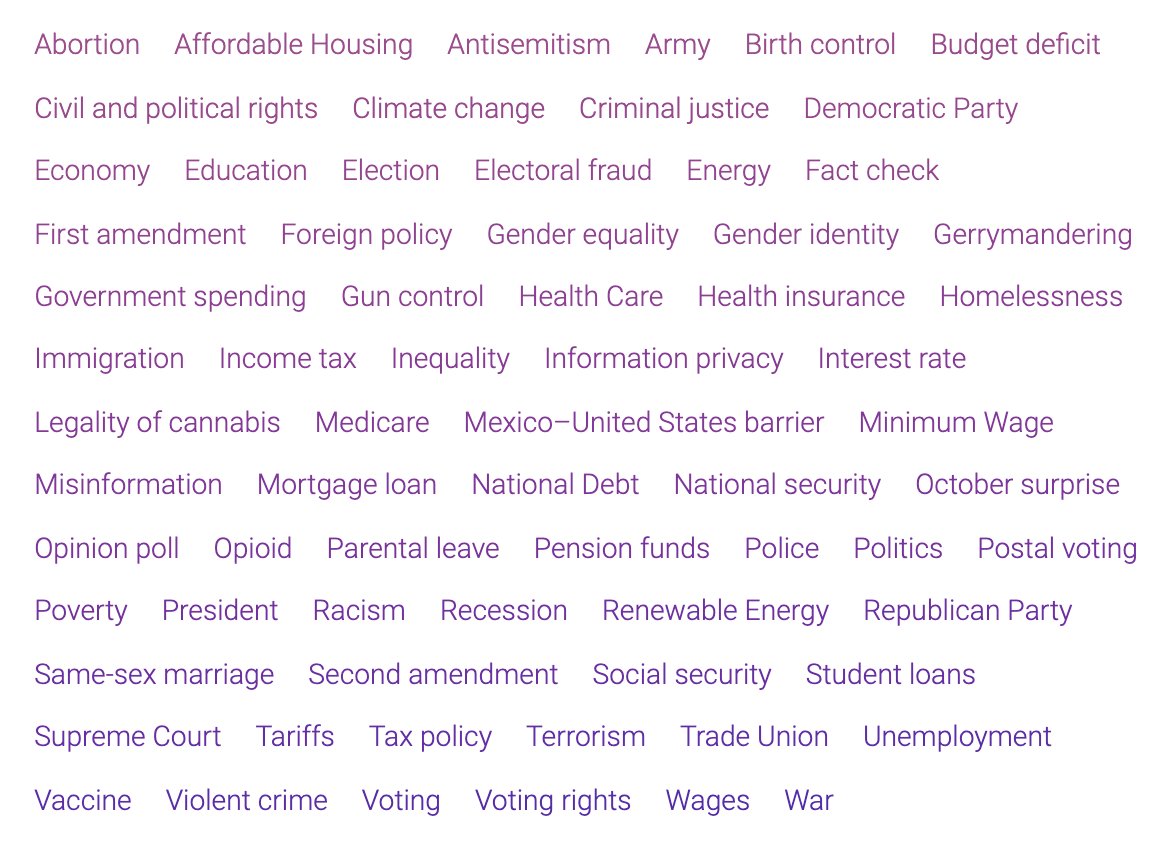
- a set of top searched political terms on Google,
- concepts from Pew surveys on top political issues in election years
- and a few manually added terms to account for recent events.
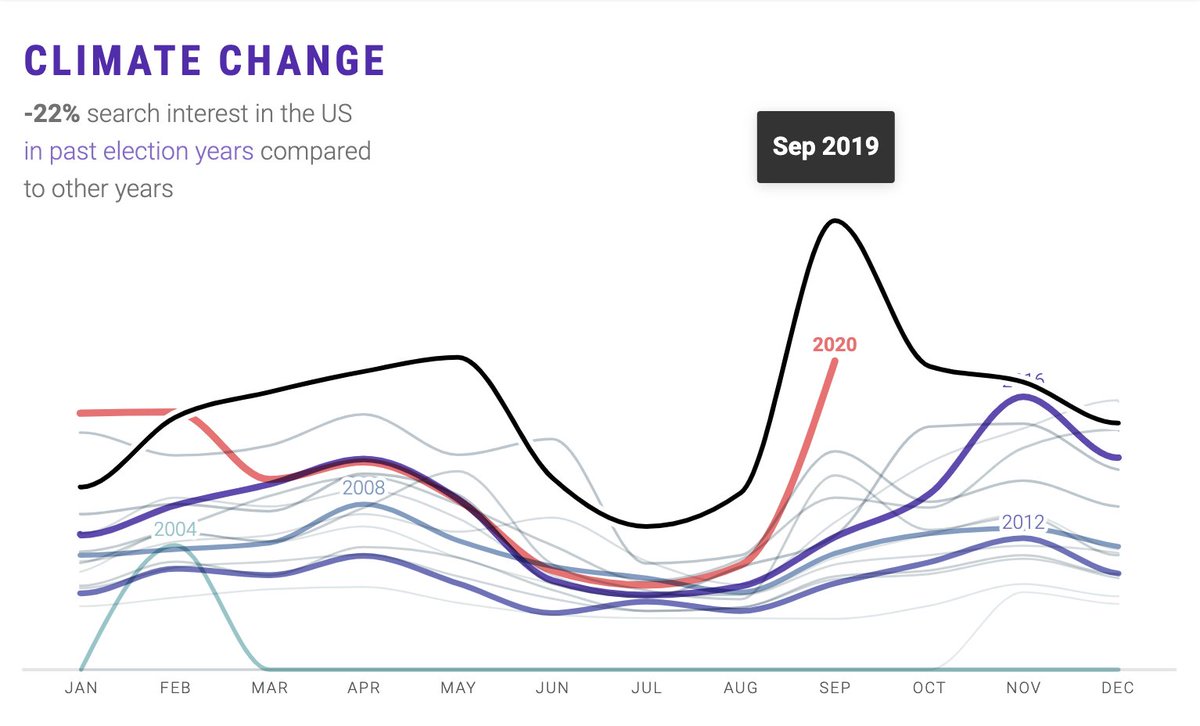
Data says YES INDEED.
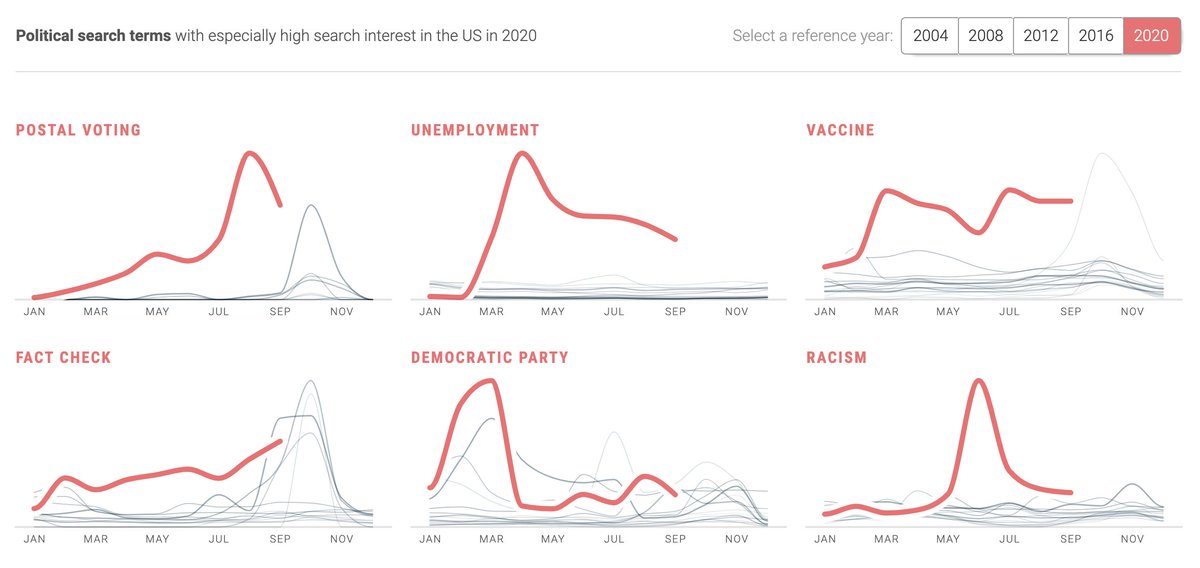
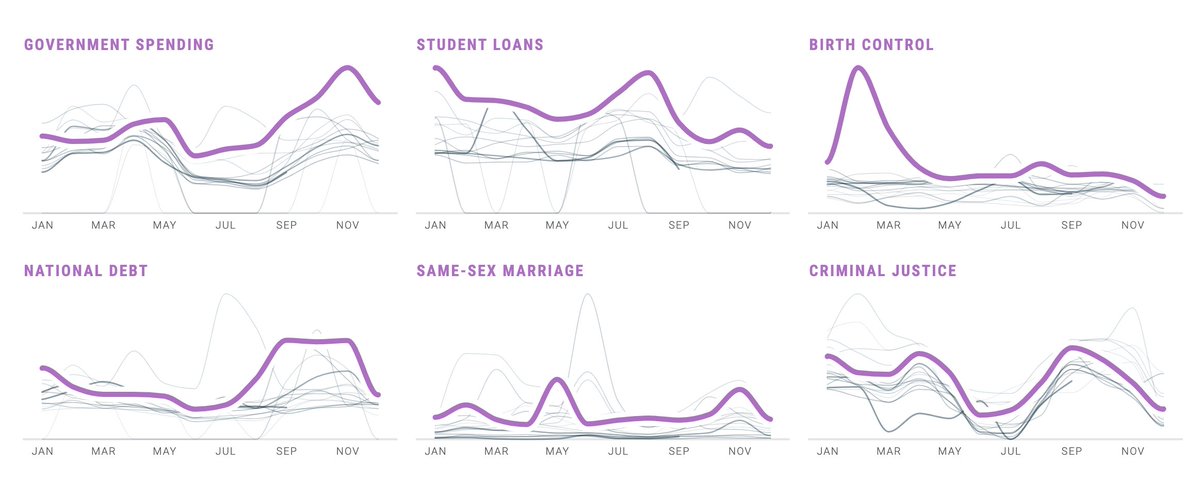
The flatness of these top issue curves, compared to 2020s attention spikiness, tells a striking story how pace of attention shifts has changed dramatically.


https://t.co/7rWPWNLyeL
https://t.co/Mskb1P6n1Z
More from Politics


You May Also Like


I just finished Eric Adler's The Battle of the Classics, and wanted to say something about Joel Christiansen's review linked below. I am not sure what motivates the review (I speculate a bit below), but it gives a very misleading impression of the book. 1/x
The meat of the criticism is that the history Adler gives is insufficiently critical. Adler describes a few figures who had a great influence on how the modern US university was formed. It's certainly critical: it focuses on the social Darwinism of these figures. 2/x
Other insinuations and suggestions in the review seem wildly off the mark, distorted, or inappropriate-- for example, that the book is clickbaity (it is scholarly) or conservative (hardly) or connected to the events at the Capitol (give me a break). 3/x
The core question: in what sense is classics inherently racist? Classics is old. On Adler's account, it begins in ancient Rome and is revived in the Renaissance. Slavery (Christiansen's primary concern) is also very old. Let's say classics is an education for slaveowners. 4/x
It's worth remembering that literacy itself is elite throughout most of this history. Literacy is, then, also the education of slaveowners. We can honor oral and musical traditions without denying that literacy is, generally, good. 5/x
As someone\u2019s who\u2019s read the book, this review strikes me as tremendously unfair. It mostly faults Adler for not writing the book the reviewer wishes he had! https://t.co/pqpt5Ziivj
— Teresa M. Bejan (@tmbejan) January 12, 2021
The meat of the criticism is that the history Adler gives is insufficiently critical. Adler describes a few figures who had a great influence on how the modern US university was formed. It's certainly critical: it focuses on the social Darwinism of these figures. 2/x
Other insinuations and suggestions in the review seem wildly off the mark, distorted, or inappropriate-- for example, that the book is clickbaity (it is scholarly) or conservative (hardly) or connected to the events at the Capitol (give me a break). 3/x
The core question: in what sense is classics inherently racist? Classics is old. On Adler's account, it begins in ancient Rome and is revived in the Renaissance. Slavery (Christiansen's primary concern) is also very old. Let's say classics is an education for slaveowners. 4/x
It's worth remembering that literacy itself is elite throughout most of this history. Literacy is, then, also the education of slaveowners. We can honor oral and musical traditions without denying that literacy is, generally, good. 5/x