Will be updating Daily Performance of our Algos in below Channel.
(2/2)
https://t.co/Q3XHJlxaeK
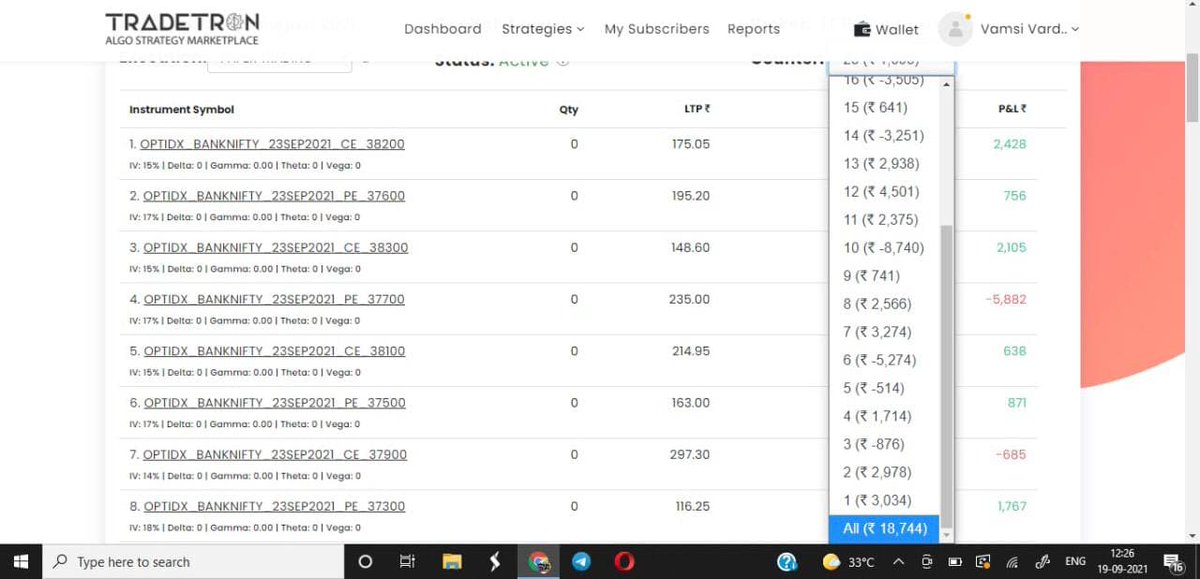
A simple INTRADAY strategy with decent BACKTEST report of more than 3-5% returns on Monthly basis.
— OptionSeller(Vardhan) (@CaVardhanCa) August 15, 2021
Will be sharing live report on daily basis for a month.
& will conduct FREE webinar to discuss about the results in coming weeks.
Sharing all rules below.
(1/n) https://t.co/VMlxNtX90s pic.twitter.com/cJaa9axRss
How you can filter stocks for Intraday trades - \U0001f9f5
— Sheetal Rijhwani (@RijhwaniSheetal) August 15, 2021
As a kid, we would do homework before school the next day - you have to do homework here too. A specific sector performs on a particular day and studying things a day before will help you spot that particular sector. (1/11)
Thread on
— Jig's Patel (@jigspatel1988) July 4, 2021
"Intraday Banknifty Strangle based on OI data"
(System already shared, today just share few examples)
(1/n)
A few setups/strategies that can make your intraday trading easy. I follow them personally:
— Sheetal Rijhwani (@RijhwaniSheetal) September 12, 2021
Add these stocks in your watchlist for next few days -
-If a stock closed exactly at resistance with good volumes or it has been consolidating near resistance for a long time. (1/10)
THREAD: 14 of the best resources/topics for anyone who wants to start option selling as a career. \U0001f9f5
— Aditya Todmal (@AdityaTodmal) March 13, 2022
Collaborated with @niki_poojary
A Thread on the Boss himself @Mitesh_Engr
— Aditya Todmal (@AdityaTodmal) July 4, 2021
Mitesh Sir's Positional Option Selling 101:
\u2022 How to find direction
\u2022 Which options to sell
\u2022 How to deploy capital
\u2022 Exit criteria
\u2022 What ROI he targets weekly
\u2022 What % risk he takes
Done with the help of @niki_poojary pic.twitter.com/tcTKV02oO2
Catch me if you can @Mitesh_Engr
— Nikita Poojary (@niki_poojary) July 17, 2021
Time for a\U0001f9f5
Mitesh Sir's EXPIRY Option Selling 101:
\u2022 What to look for?
\u2022 Strike Selection & Ratios
\u2022 SL mgmt
\u2022 Avoiding freezes
\u2022 Monthy Expiry
\u2022 Event days
\u2022 How he would have traded last expiry?
In collaboration with @AdityaTodmal pic.twitter.com/9uN2vQQ4hc
Time for a Thread\U0001f9f5On yesterday\u2019s \u201cF&O Pe Charcha - Diary Of An Option Seller\u201d with @Mitesh_Engr by @Paytm Money
— Nikita Poojary (@niki_poojary) August 1, 2021
I'm increasingly interested in the idea of "personal moats" in the context of careers.
— Erik Torenberg (@eriktorenberg) November 22, 2018
Moats should be:
- Hard to learn and hard to do (but perhaps easier for you)
- Skills that are rare and valuable
- Legible
- Compounding over time
- Unique to your own talents & interests https://t.co/bB3k1YcH5b
People talk about \u201cpassive income\u201d a lot but not about \u201cpassive social capital\u201d or \u201cpassive networking\u201d or \u201cpassive knowledge gaining\u201d but that\u2019s what you can architect if you have a thing and it grows over time without intensive constant effort to sustain it
— Andrew Chen (@andrewchen) November 22, 2018
Things that look like moats but likely aren\u2019t or may fade:
— Erik Torenberg (@eriktorenberg) November 22, 2018
- Proprietary networks
- Being something other than one of the best at any tournament style-game
- Many "awards"
- Twitter followers or general reach without "respect"
- Anything that depends on information asymmetry https://t.co/abjxesVIh9
Beautifully read: why bookselfies are all over Instagram https://t.co/pBQA3JY0xm
— Guardian Books (@GuardianBooks) October 30, 2018