
with a stop of 34900 ( 100 point difference). This essentially means that the 35000 atm options will have a stop of Rs 200 ( delta 0.5) assuming all other things are equal. So the number of lots U should typically deal with based on 1% Risk on 5 lacs capital ...
#FreeTip
Basic rule for day trading in option buying for beginners.
1) Stick to monthly atm options.
2) Suppose u have a capital of Rs 5 lacs. Your max risk appetite is 1% which is 5k. Assume u look at BNF chart and find a buy setup at 35000 ...
with a stop of 34900 ( 100 point difference). This essentially means that the 35000 atm options will have a stop of Rs 200 ( delta 0.5) assuming all other things are equal. So the number of lots U should typically deal with based on 1% Risk on 5 lacs capital ...
is 5000 / 200, which is 25 , ie 1 lot. If your risk appetite is 2%, then u are allowed to take 50, ie 2 lots. Hence if option price is say, Rs 400, ur stop will be 200 and u have to deal with one lot which means your deployment is 25 x 400 = Rs 10,000....
More from HMK alias MANOJ
#Learning Those who are interested in options... Here is an old tweet on gamma scalping ...
#Straddle #Gammascalping #Learning Success In option writing can be achieved only by adjustments based on the market developments. The same goes with straddle strategy as well. A method called gamma scalping helps to minimize potential loss in straddles. pic.twitter.com/qgSmgd8RWM
— HMK alias MANOJ (@scorpiomanojFRM) June 19, 2020
#FREETIPS
For new followers ...
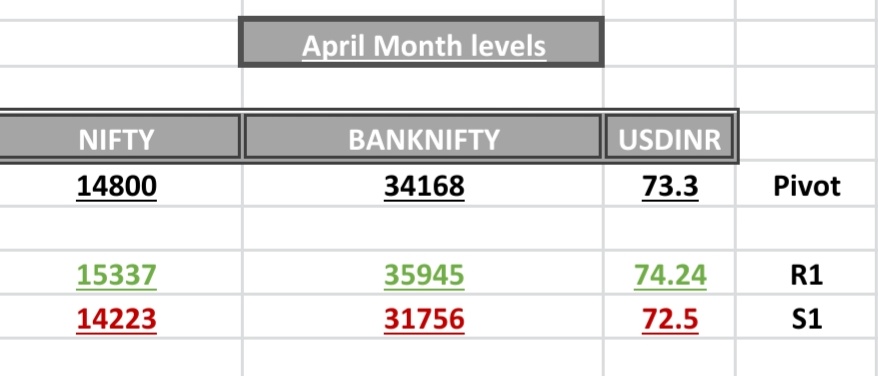
If u r a pivot based intraday trader, u should have this cheat sheet. Follow this and C. Your wrong trades will reduce considerably. Good luck.
For new followers ...
If u r a pivot based intraday trader, u should have this cheat sheet. Follow this and C. Your wrong trades will reduce considerably. Good luck.
#FREETIPS
— ScorpioManoj (@scorpiomanojFRM) April 1, 2022
Pivot Rules snapshot
A free one page cheat sheet for pivot based trading that could probably be sold for a hefty price ....
Rem: This is just a broad set of rules. There are many advance rules more than this. pic.twitter.com/FnzmGGKx0P
More from Optionslearnings

Tata Consumer too
There u have 30 now
Stick to these only !!!!
I keep getting msgs from ppl stuck in other stocks.
Just yday, someone asked abt Mindtree.
he shorted a CE and then when he wanted to cover,
the spread was 70 / 92 !!!
How many have faced such a problem?
Please add to this thread with actual examples
stock / strike price and rate
There u have 30 now
Stick to these only !!!!
HCLTECH
— Pathik (@Pathik_Trader) March 31, 2021
WIPRO
M&M
TITAN
Adding into list
Remove AUROPHARMA, BHARTIARTL, TAMO from list (personal hate\U0001f603\U0001f603)
I keep getting msgs from ppl stuck in other stocks.
Just yday, someone asked abt Mindtree.
he shorted a CE and then when he wanted to cover,
the spread was 70 / 92 !!!
How many have faced such a problem?
Please add to this thread with actual examples
stock / strike price and rate


DJ SIR THREAD
Great video with points helpful for beginners.
Made 4 threads on DJ Sir with the help of @niki_poojary
1. Selecting strikes to trade in with risk management.
2. How he took some aggressive trades.
3. Multiple charts analysis for intraday trading.
4. Trade Setup
Attaching all threads made on DJ Sir. After watching the video you can refer to this tweet for notes about his strategy and learn a few other ideas.
Compiling these together for easy access to his knowledge.
1. Selecting strikes and risk
2. Going aggressive with help of data and
3. Intraday
Great video with points helpful for beginners.
Made 4 threads on DJ Sir with the help of @niki_poojary
1. Selecting strikes to trade in with risk management.
2. How he took some aggressive trades.
3. Multiple charts analysis for intraday trading.
4. Trade Setup
https://t.co/Ngoc5bh906 Thank Mahek bhai for making this video basis my set up which i have been following since past 2 yr I\u2019m not promoting this software, neither I 'll gain any referral if anyone subscribes for this software ,Purpose is to share help fellow traders!\U0001f60a
— itrade(DJ) (@ITRADE191) September 5, 2021
Attaching all threads made on DJ Sir. After watching the video you can refer to this tweet for notes about his strategy and learn a few other ideas.
Compiling these together for easy access to his knowledge.
1. Selecting strikes and risk
5. A THREAD on . . . .
— Aditya Todmal (@AdityaTodmal) July 11, 2021
How @ITRADE191 selects strikes to trade in and how he follows risk management.
Short thread explained via pictures with the help of @niki_poojary.https://t.co/YiYYaIReNS
2. Going aggressive with help of data and
6. Thread on how @ITRADE191 made 3 lakhs in 2 days.
— Aditya Todmal (@AdityaTodmal) July 11, 2021
You will need:
1. Pivots
2. Vwap
3. PDL/PDH (Previous day high/low)
4. Advance/Decline Ratio.https://t.co/o9tLOaLpEh
3. Intraday
7. DJ @ITRADE191 multiple chart analysis for INTRADAY TRADING.
— Aditya Todmal (@AdityaTodmal) July 11, 2021
1. Core setup
2. Pivot points trades
3. PDH/PDL trades
4. Open interest addictions combined with rejections on charts.
5. Website to confirm biashttps://t.co/qZQCWOSisa


A Thread on How to NOT do blunders while selling Options. 🧵🪡
1. Never be Greedy in a High Vix Environment.
Sellers selling OTM get lured by higher premiums and sell near ATM or more than they usually do, this will burn your hand as High premiums also mean that you will end up giving higher premium back than usual as soom as it spikes.

2. Hope
Hope drives a man crazy and this is true for trading the most, hoping for a reversal to cut the pain. Humans have a tendency to avoid the pain and one does not accept the pain by not booking a loss
Tom Hougaard explains this well below.
https://t.co/zDbDT2hdej

3. Not having a setup in non directional Selling
You cannot make money long term if you don’t have a set of rules or adjustments in place already if you are trading long term. Make a plan or a system so that you always know how to survive. Your Position is non D not the market.

4. Getting Egoistic
Many people think they are supreme because they are selling options much likely because of the Trend on Twitter in the community,
You are a trader think like one and remain one trading a certain way does not make you better.

1. Never be Greedy in a High Vix Environment.
Sellers selling OTM get lured by higher premiums and sell near ATM or more than they usually do, this will burn your hand as High premiums also mean that you will end up giving higher premium back than usual as soom as it spikes.
2. Hope
Hope drives a man crazy and this is true for trading the most, hoping for a reversal to cut the pain. Humans have a tendency to avoid the pain and one does not accept the pain by not booking a loss
Tom Hougaard explains this well below.
https://t.co/zDbDT2hdej
3. Not having a setup in non directional Selling
You cannot make money long term if you don’t have a set of rules or adjustments in place already if you are trading long term. Make a plan or a system so that you always know how to survive. Your Position is non D not the market.
4. Getting Egoistic
Many people think they are supreme because they are selling options much likely because of the Trend on Twitter in the community,
You are a trader think like one and remain one trading a certain way does not make you better.
You May Also Like


First thread of the year because I have time during MCO. As requested, a thread on the gods and spirits of Malay folk religion. Some are indigenous, some are of Indian origin, some have Islamic
Before I begin, it might be worth explaining the Malay conception of the spirit world. At its deepest level, Malay religious belief is animist. All living beings and even certain objects are said to have a soul. Natural phenomena are either controlled by or personified as spirits
Although these beings had to be respected, not all of them were powerful enough to be considered gods. Offerings would be made to the spirits that had greater influence on human life. Spells and incantations would invoke their
Two known examples of such elemental spirits that had god-like status are Raja Angin (king of the wind) and Mambang Tali Arus (spirit of river currents). There were undoubtedly many more which have been lost to time
Contact with ancient India brought the influence of Hinduism and Buddhism to SEA. What we now call Hinduism similarly developed in India out of native animism and the more formal Vedic tradition. This can be seen in the multitude of sacred animals and location-specific Hindu gods
i wonder if you can make a thread bout witchcraft in malaysia.. or list of our own local gods/deites..
— r a y a \U0001f319 (@lcvelylilith) February 20, 2020
Before I begin, it might be worth explaining the Malay conception of the spirit world. At its deepest level, Malay religious belief is animist. All living beings and even certain objects are said to have a soul. Natural phenomena are either controlled by or personified as spirits
Although these beings had to be respected, not all of them were powerful enough to be considered gods. Offerings would be made to the spirits that had greater influence on human life. Spells and incantations would invoke their
Animist ceremonies of a religious or magical nature were normally held for the purpose of divination or making a request. This would either be done at a keramat or at a shrine similar to the Thai spirit houses or Chinese roadside shrines pic.twitter.com/I1hliyi0x3
— \u2745\u1710\u170b\u1713\u170e (@uglyluhan) June 16, 2019
Two known examples of such elemental spirits that had god-like status are Raja Angin (king of the wind) and Mambang Tali Arus (spirit of river currents). There were undoubtedly many more which have been lost to time
Contact with ancient India brought the influence of Hinduism and Buddhism to SEA. What we now call Hinduism similarly developed in India out of native animism and the more formal Vedic tradition. This can be seen in the multitude of sacred animals and location-specific Hindu gods

@franciscodeasis https://t.co/OuQaBRFPu7
Unfortunately the "This work includes the identification of viral sequences in bat samples, and has resulted in the isolation of three bat SARS-related coronaviruses that are now used as reagents to test therapeutics and vaccines." were BEFORE the

chimeric infectious clone grants were there.https://t.co/DAArwFkz6v is in 2017, Rs4231.
https://t.co/UgXygDjYbW is in 2016, RsSHC014 and RsWIV16.
https://t.co/krO69CsJ94 is in 2013, RsWIV1. notice that this is before the beginning of the project
starting in 2016. Also remember that they told about only 3 isolates/live viruses. RsSHC014 is a live infectious clone that is just as alive as those other "Isolates".
P.D. somehow is able to use funds that he have yet recieved yet, and send results and sequences from late 2019 back in time into 2015,2013 and 2016!
https://t.co/4wC7k1Lh54 Ref 3: Why ALL your pangolin samples were PCR negative? to avoid deep sequencing and accidentally reveal Paguma Larvata and Oryctolagus Cuniculus?
Unfortunately the "This work includes the identification of viral sequences in bat samples, and has resulted in the isolation of three bat SARS-related coronaviruses that are now used as reagents to test therapeutics and vaccines." were BEFORE the
chimeric infectious clone grants were there.https://t.co/DAArwFkz6v is in 2017, Rs4231.
https://t.co/UgXygDjYbW is in 2016, RsSHC014 and RsWIV16.
https://t.co/krO69CsJ94 is in 2013, RsWIV1. notice that this is before the beginning of the project
starting in 2016. Also remember that they told about only 3 isolates/live viruses. RsSHC014 is a live infectious clone that is just as alive as those other "Isolates".
P.D. somehow is able to use funds that he have yet recieved yet, and send results and sequences from late 2019 back in time into 2015,2013 and 2016!
https://t.co/4wC7k1Lh54 Ref 3: Why ALL your pangolin samples were PCR negative? to avoid deep sequencing and accidentally reveal Paguma Larvata and Oryctolagus Cuniculus?