#NTPC when was the last time stock moved 20rs(15%) in 4 days?
What was on the charts ?
Once 135 was crossed there was no looking back @moneyworks4u_fa
Lots of hints given 😊🙏
#NTPC -- On the verge of 13yr breakout above 140-144 can do 170-180 pic.twitter.com/eDBGHVqlYz
— Shivaji Vitthalrao\U0001f1ee\U0001f1f3 (@shivaji_1983) March 24, 2022
More from Shivaji Vitthalrao🇮🇳
155-175 Major support and also retest of breakout.
275-220 Probabable targets in medium term.
#PRAJIND https://t.co/dsbj25WPbQ
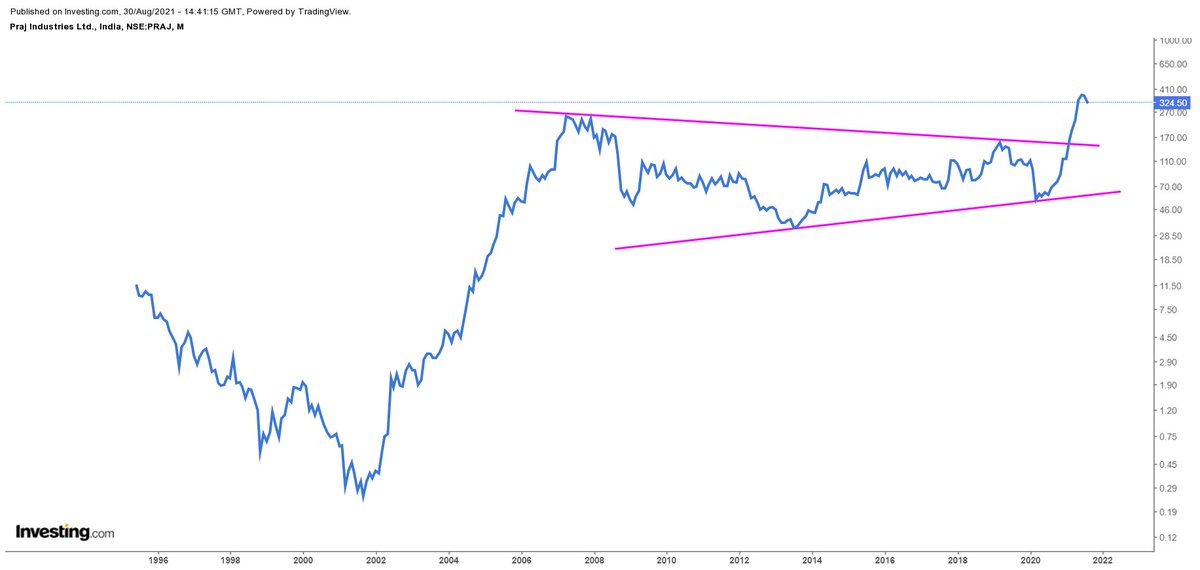
Thanks. Praj Industries perfect smart distribution. More weakness below 336. Rise to 355-365 can face selling pressure.
— Shivaji Vitthalrao\U0001f1ee\U0001f1f3 (@shivaji_1983) August 10, 2021
Below 336 I see 275 in few months as long as its trading below 388 on closing basis CMP 351. https://t.co/iMRpbTfOpU pic.twitter.com/mKwgDwreaU

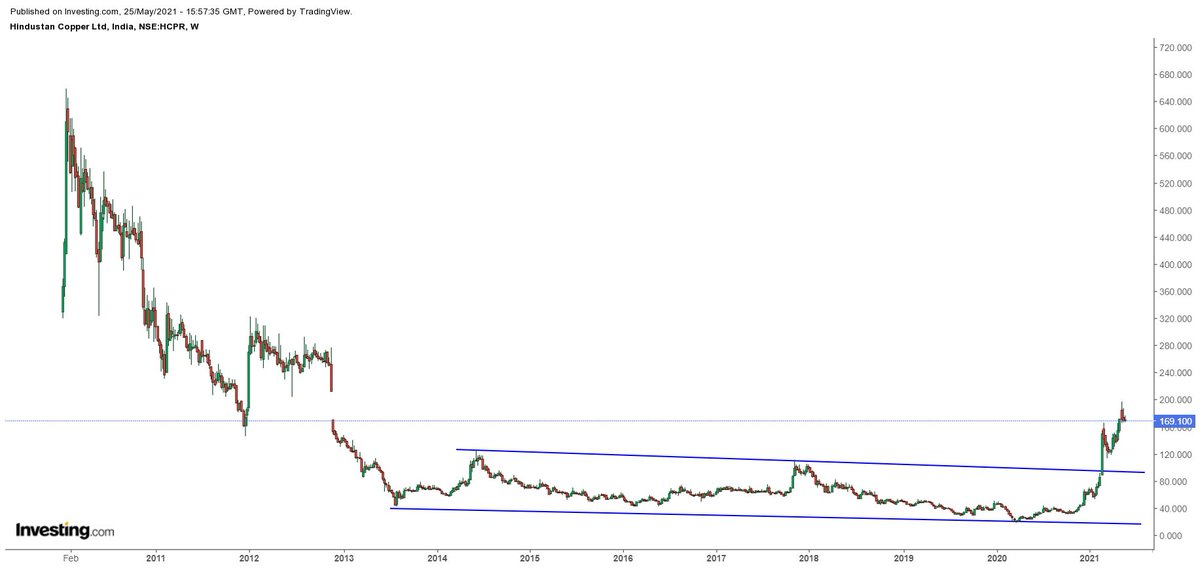

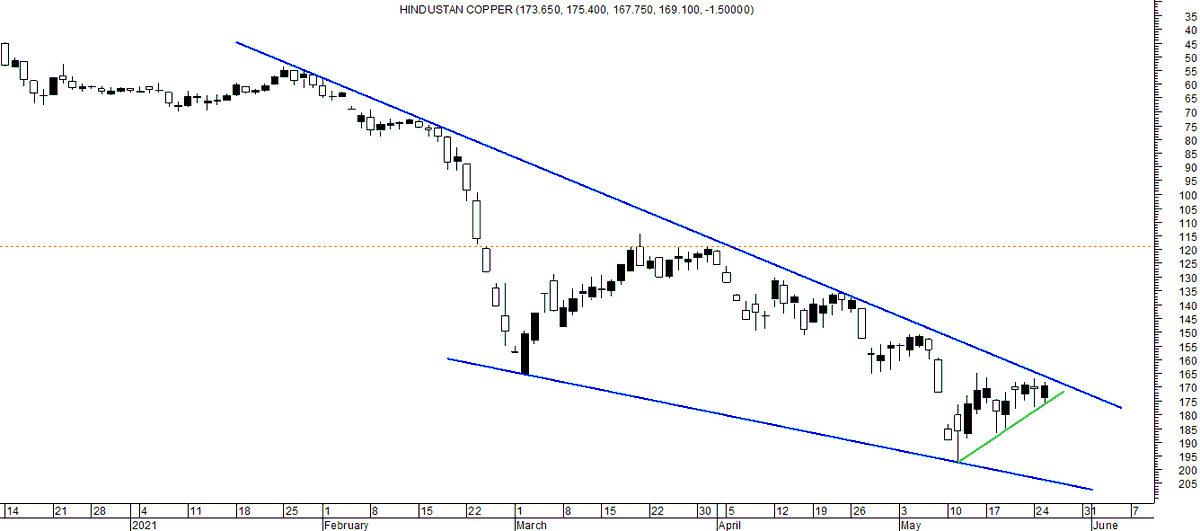

Copper break below 4.43 qualify as bearish Flag and pole
HINDCOPPER break below 157 qualify as bearish Flag n pole.
Impact copper can test 4.28-4.20
HINDCOPPER can test 150-141 as per pattern targets.
165-166 Lakshman Rekha.
Quiz - Hindcopper
— Shivaji Vitthalrao\U0001f1ee\U0001f1f3 (@shivaji_1983) June 9, 2021
What pattern do you see?
whats the confirmation level and impact ?
Both are interlinked. https://t.co/0gVaRXd4pS pic.twitter.com/Bbs1rdaOWf
Could be best innings of 2022 🤑
BIG Boy of PSU Bank space is ready to make its best move after 8-9 months of consolidation.
— Shivaji Vitthalrao\U0001f1ee\U0001f1f3 (@shivaji_1983) July 7, 2022
Time for #SBI Great Again. Some more days move can trigger, stock can head towards 540-600-650-680 and more in 2022. @moneyworks4u_fa @dtbhat pic.twitter.com/N6dBJNC36s
105 is key, Bulls might defend for the time being. Once they fail during any downtrend Boy Bulls will be in serious trouble.
First targets 90-95 and worst case 65-70 (This i wil review later) https://t.co/RYaMwRQb7e
Angle 2 -- On Log scale its end of this upmove from March 2020.
— Shivaji Vitthalrao\U0001f1ee\U0001f1f3 (@shivaji_1983) August 24, 2021
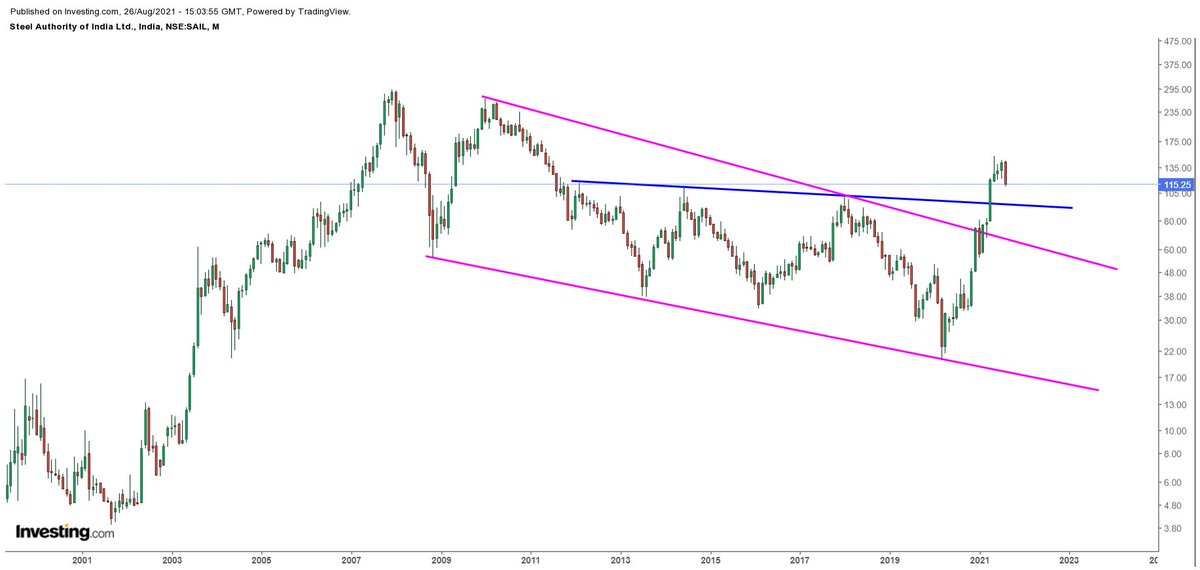
No major support until 90-92.
Conclusion - any rise to 123-128 is a sell opportunity
Bullish only above 145. Personally not bulish.
Potential taregts on downside are 105-90#SAIL pic.twitter.com/yZv2WXwIMU