Managing a 5-8 ppl team does not leave you time to design. When you don't practice a craft, you should not expect to get better at it.
A frequent question I get when talking with senior designers: Will my growth as a designer stall if I start managing?
There is often a second question underneath that, which is:
Will I no longer be respected as a design leader if I can't keep up as a designer?
Thread below👇
Managing a 5-8 ppl team does not leave you time to design. When you don't practice a craft, you should not expect to get better at it.
What you *can* continue to grow (as both a design manager and a designer) is the following:
1) Your design eye
2) Your design voice
It means your taste is well-honed through extensive study of an area.
It means your sense for usability, simplicity and aesthetics is well-developed even at subtle or fine granularities.
As a designer, your work is limited by how good your eye is. Your eye can be way better than your work—for many junior designers it is—but the opposite is impossible.
1) Study the craft. Look at hundreds of examples.
2) Read or discuss critical commentary. Talk to the most obsessed people you know on the topic, and they'll help you understand what to look for.
3) Practice by designing.
Simply saying "This isn't good enough" is not helpful.
More from Life
You May Also Like
1/OK, data mystery time.
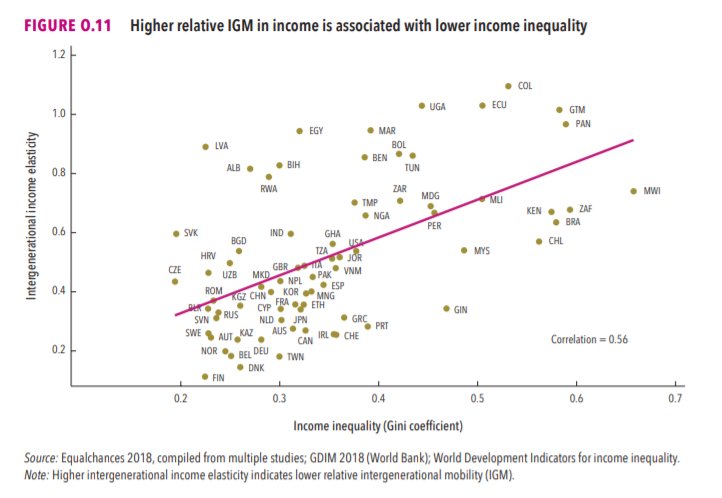
This New York Times feature shows China with a Gini Index of less than 30, which would make it more equal than Canada, France, or the Netherlands. https://t.co/g3Sv6DZTDE
That's weird. Income inequality in China is legendary.
Let's check this number.
2/The New York Times cites the World Bank's recent report, "Fair Progress? Economic Mobility across Generations Around the World".
The report is available here:
3/The World Bank report has a graph in which it appears to show the same value for China's Gini - under 0.3.
The graph cites the World Development Indicators as its source for the income inequality data.

4/The World Development Indicators are available at the World Bank's website.
Here's the Gini index: https://t.co/MvylQzpX6A
It looks as if the latest estimate for China's Gini is 42.2.
That estimate is from 2012.
5/A Gini of 42.2 would put China in the same neighborhood as the U.S., whose Gini was estimated at 41 in 2013.
I can't find the <30 number anywhere. The only other estimate in the tables for China is from 2008, when it was estimated at 42.8.
This New York Times feature shows China with a Gini Index of less than 30, which would make it more equal than Canada, France, or the Netherlands. https://t.co/g3Sv6DZTDE
That's weird. Income inequality in China is legendary.
Let's check this number.
2/The New York Times cites the World Bank's recent report, "Fair Progress? Economic Mobility across Generations Around the World".
The report is available here:
3/The World Bank report has a graph in which it appears to show the same value for China's Gini - under 0.3.
The graph cites the World Development Indicators as its source for the income inequality data.

4/The World Development Indicators are available at the World Bank's website.
Here's the Gini index: https://t.co/MvylQzpX6A
It looks as if the latest estimate for China's Gini is 42.2.
That estimate is from 2012.
5/A Gini of 42.2 would put China in the same neighborhood as the U.S., whose Gini was estimated at 41 in 2013.
I can't find the <30 number anywhere. The only other estimate in the tables for China is from 2008, when it was estimated at 42.8.


