Kolaru Pathigam-Thevaram hymn composed by ThiruGnana Sambandar- #Thread
In Tamil Kol means planets,Aru means cut- set of songs in Kolaru Pathigam addresses all Navagrahas& last 2 lines of every song with end a plea to Bhagwan Shiva to reduce/erase the ill effects of Navagrahas
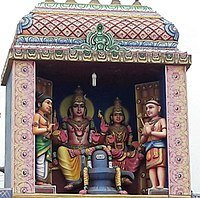
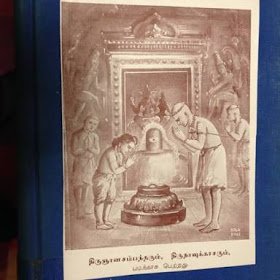
கோளறு பதிகம் - This pathigam was sung by Thirugnana Sambandar at Thirumaraikadu Kshetram -Vedaranyam,Tamilnadu
Thirugnana Sambandar & Appar(Thirunavukkarasar) travelled together to various Shiva Alayam to spread shivam & bhakti among people.They both reached Thirumaraikadu.
Thirumaraikadu(Vedaranyam) -
Appar & Sambandar were asked to enter the temple through side entrance.The main door was locked by Vedas many years ago.Appar&Sambandar sang devotional hymns praising Shiva, after which the gates opened & closed.After which main door opened for all.
After darshan of Bhagwan Shiva at Thirumaraikkadu,Sambandar received a message to travel to Madurai.
During that time, Samanam was on the rise in the Pandya Kingdom.The Pandya King converted to Samanam.The Queen Mangaiyarkkarasi was a staunch Shiva devotee and was upset.
Kularchirai Nayanar ,Chief Minister of Pandya kingdom was in agony by the turn of events.Queen requested Kulachirai Nayanar to escort Thiru gnana Sambandar to Madurai.Kularchirai Nayanar met Thiru gnana Sambandar at Thirumaraikkadu & requested him to visit Madurai.