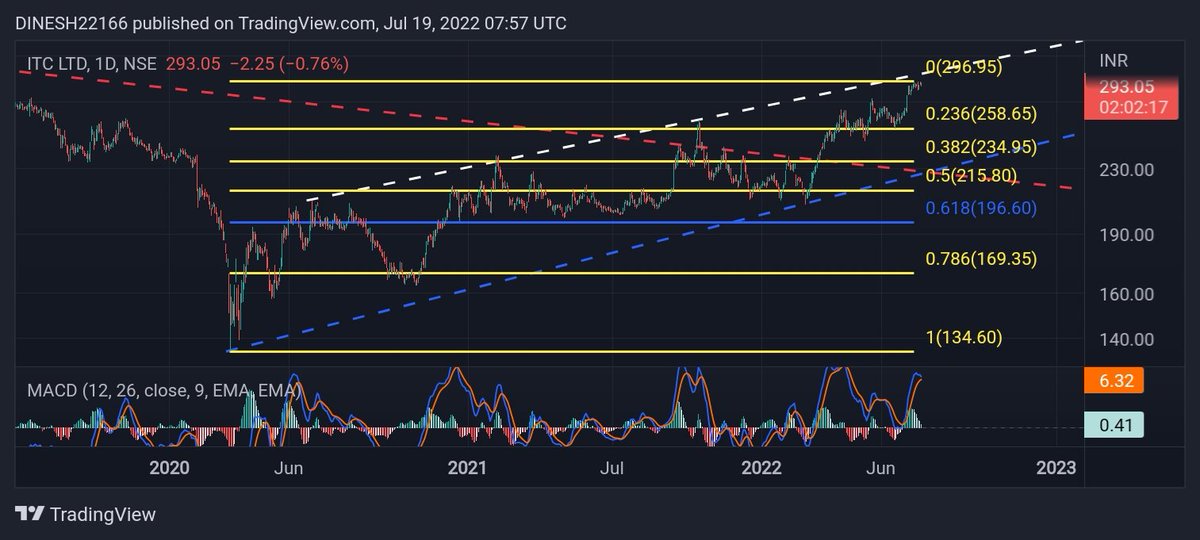
#ITC -293
Daily chart. #MACD About to turn negative.
Due to overlapping structure.
If not immediately new high.
If this happens then lower Fibonacci retracement level 0.236%(258)
0.382% (234) likely to be tested.
Which is also trendline breakout.
View valid till it not cross 311
More from Waves_Perception(Dinesh Patel) मैंSchedule Tribe)
#CDSL -1337
Either entry only above 1600 or let it
correct towards 987...
#Update
Either entry only above 1600 or let it
correct towards 987...
#Update
#CDSL -1050
— MaRkET WaVES (DINESH PATEL ) Stock Market FARMER (@idineshptl) July 9, 2021
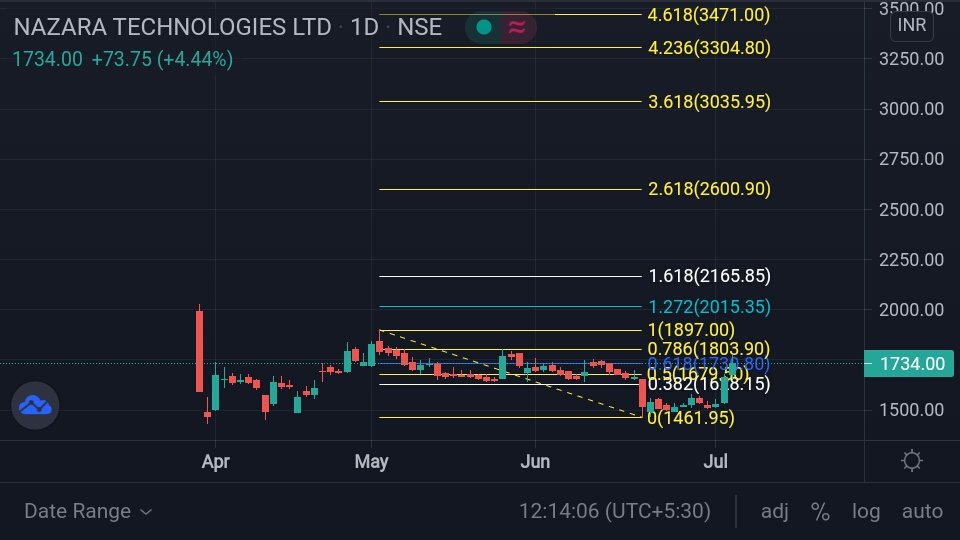
Now above 2.618% and objective is to move higher towards 3.618%
4.236% and 4.618%....
What will Drag lower this stock price \U0001f602 ?
Only if you can sell your holding
Means Verticle rise ?
Than why it decline from (486-180.)#Observation #Perspective pic.twitter.com/evxYOjH8Qv
#LTI -4614
Probability towards 4.618% and beyond..
#Possibility
Probability towards 4.618% and beyond..
#Possibility
#LTI -4145
— MaRkET WaVES (DINESH PATEL ) Stock Market FARMER (@idineshptl) July 14, 2021
Near term base Case (4024)
Look for 4.618% and 6.857%
Long term perspective Fibonacci extension shown in chart. #Perspective pic.twitter.com/Pyl0aGYIuS