THE LESSER KNOWN MAHARANA OF MEWAR:RANA KUMBHA
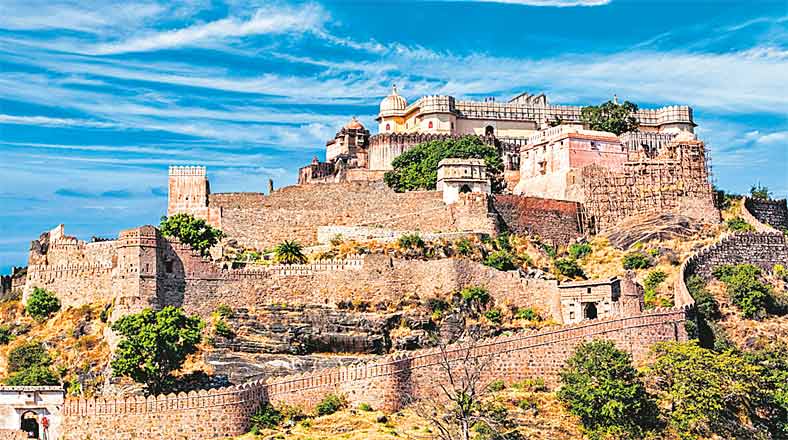
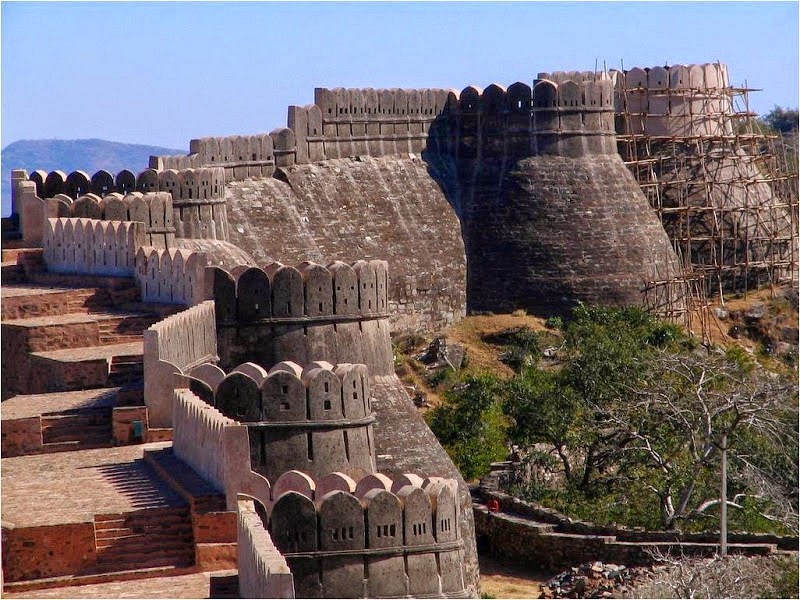
Kumbalgarh Fort is one of most spectacular sites of India,atop a hill abt 3600ft above sea lvl in the https://t.co/LkjmzzBhE2's second largest wall is surrounding it.A fort wall second only to Great wall of China,still not so famous.
This longest wall of India stretches to almost 36Km and encompasses a few hills, many step wells and over 360 temples and palaces. Birth place of the Great Maharana Pratap, this fort is named after another Great Maharana of Mewar, who is not given his due in the History.
Builder of many architectural marvels like the Kumbhalgarh Fort, an erudite scholar, a patron of arts, music, culture & a great warrior was the Great Maharana Kumbha. Yet we don't know much about him. Let's get to know him a little.
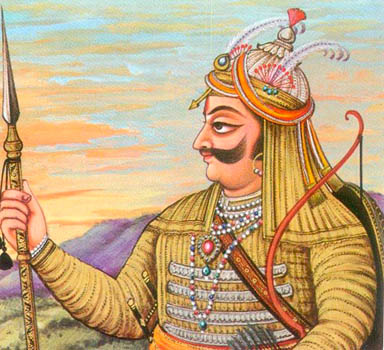
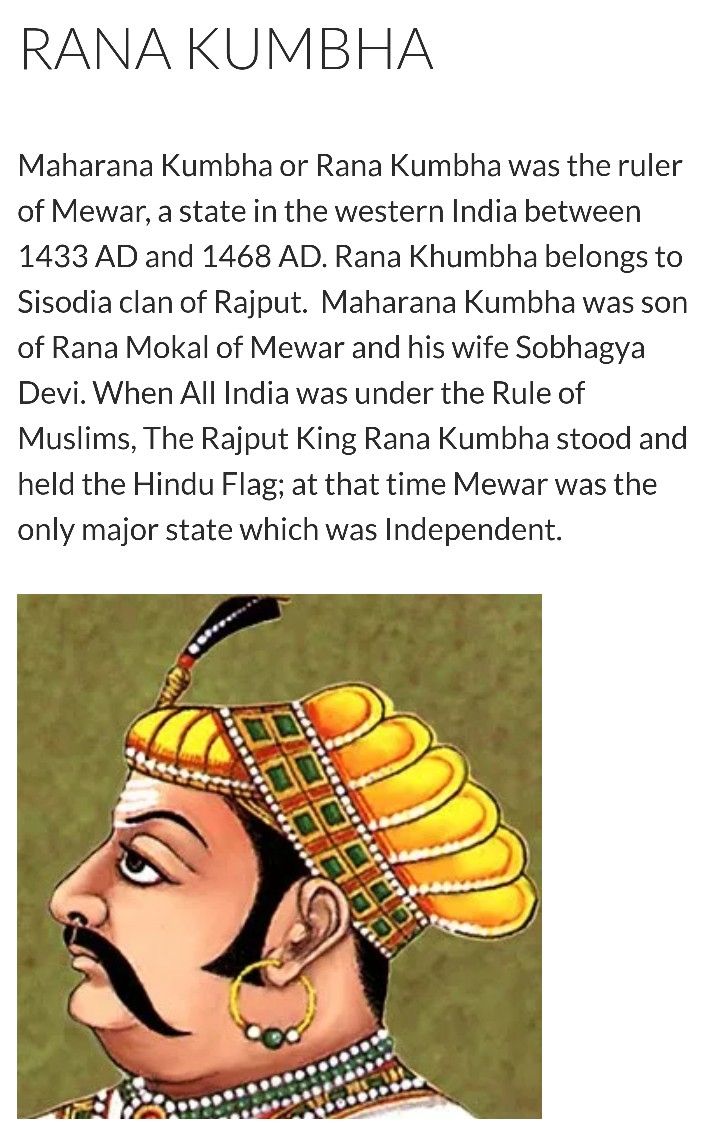
Maharana Kumbha was the undefeated King of Mewar from 1433-1468CE.He never lost any battles &kept Mewar out of the reach of Islamic Invaders till the time he was alive. Born on Makar Sakranti to Maharana Mokal & Saubhagya Devi, Rana Kumbha was only 13 when he ascended the throne.
His father was killed by his own relatives in a political conspiracy. He was a powerful King about 8ft tall &charismatic personality,a hardcore Hindu Rajput who could shed his life for Hindu honour without thinking twice.He was an ardent skillful warrior who never lost a battle.