Andhra Pradesh : 21.2%
Bihar : 22%
Gujarat : 31.5%
Karnataka : 30%
Kerala : 55%
Maharashtra : 35%
Tamil Nadu : 36.4%
Uttar Pradesh : 20.9%
West Bengal : 34.5%
India : 28.3%

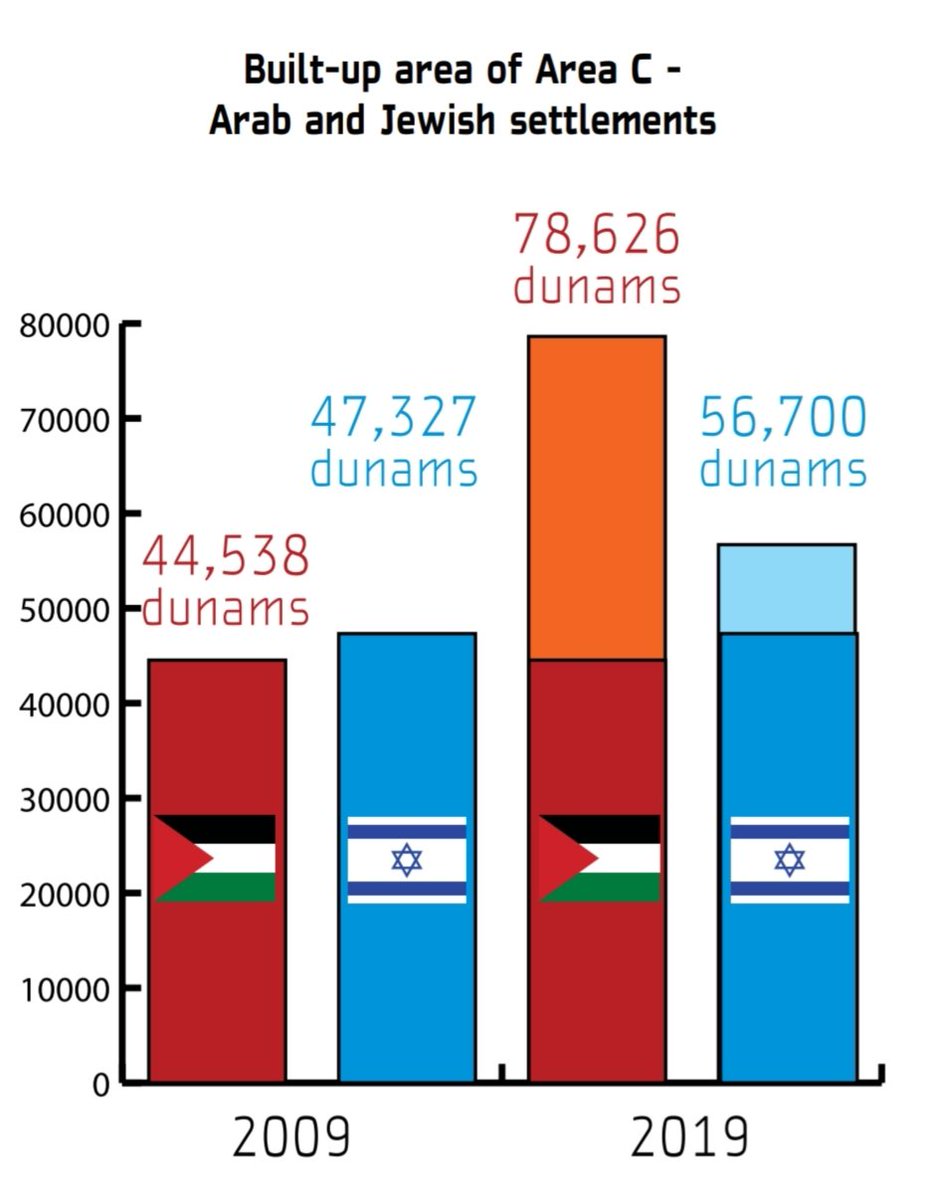
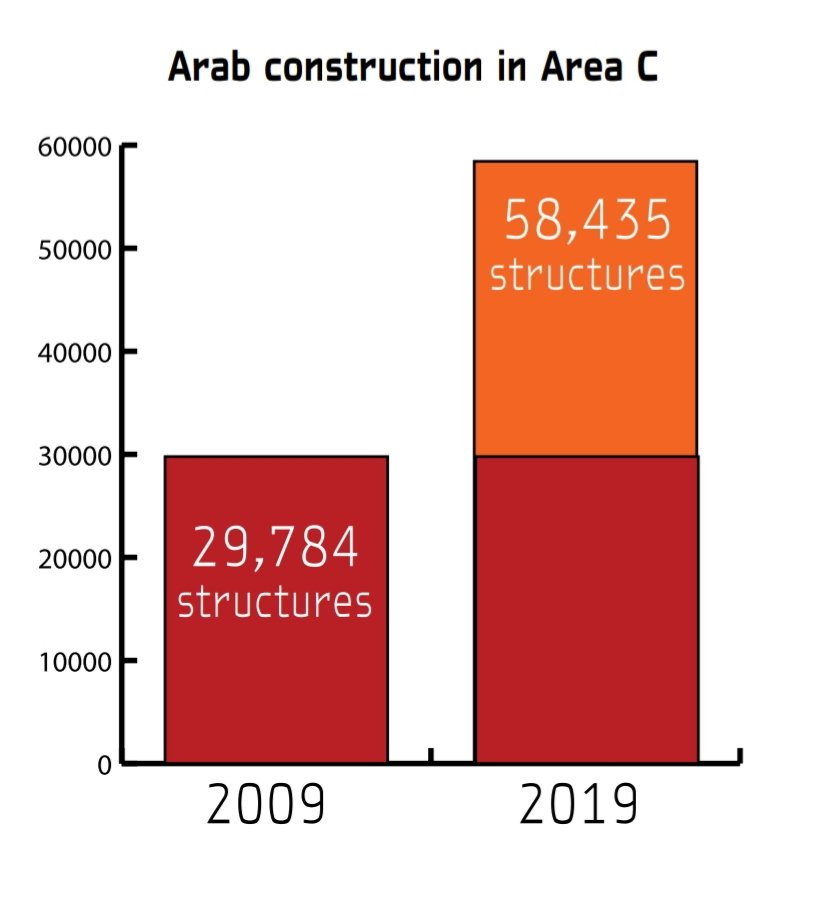
Israel works to "Judaize" the entire area, treating the land as a resource chiefly meant to benefit the Jewish population. Jewish communities are established and developed, while Palestinians are dispossessed and corralled into small, crowded enclaves.https://t.co/DFU922lNvC pic.twitter.com/d36H8OVgdD
— B'Tselem \u05d1\u05e6\u05dc\u05dd \u0628\u062a\u0633\u064a\u0644\u0645 (@btselem) January 14, 2021