
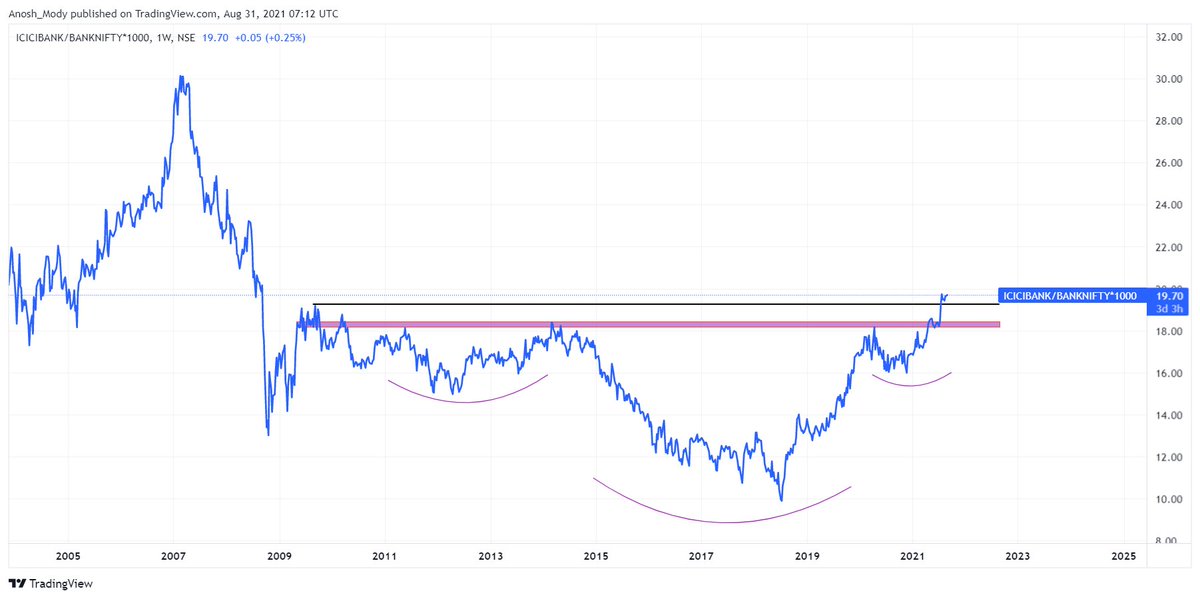
$ICICIBANK.NSE / $NIFTYBANK.NSE
Ratio chart, breaking out after a decade of underperformance. Bullish on $ICICIBANK.NSE !
More from Anosh Mody


More from Icicibank


You May Also Like


"I lied about my basic beliefs in order to keep a prestigious job. Now that it will be zero-cost to me, I have a few things to say."
We know that elite institutions like the one Flier was in (partial) charge of rely on irrelevant status markers like private school education, whiteness, legacy, and ability to charm an old white guy at an interview.
Harvard's discriminatory policies are becoming increasingly well known, across the political spectrum (see, e.g., the recent lawsuit on discrimination against East Asian applications.)
It's refreshing to hear a senior administrator admits to personally opposing policies that attempt to remedy these basic flaws. These are flaws that harm his institution's ability to do cutting-edge research and to serve the public.
Harvard is being eclipsed by institutions that have different ideas about how to run a 21st Century institution. Stanford, for one; the UC system; the "public Ivys".
As a dean of a major academic institution, I could not have said this. But I will now. Requiring such statements in applications for appointments and promotions is an affront to academic freedom, and diminishes the true value of diversity, equity of inclusion by trivializing it. https://t.co/NfcI5VLODi
— Jeffrey Flier (@jflier) November 10, 2018
We know that elite institutions like the one Flier was in (partial) charge of rely on irrelevant status markers like private school education, whiteness, legacy, and ability to charm an old white guy at an interview.
Harvard's discriminatory policies are becoming increasingly well known, across the political spectrum (see, e.g., the recent lawsuit on discrimination against East Asian applications.)
It's refreshing to hear a senior administrator admits to personally opposing policies that attempt to remedy these basic flaws. These are flaws that harm his institution's ability to do cutting-edge research and to serve the public.
Harvard is being eclipsed by institutions that have different ideas about how to run a 21st Century institution. Stanford, for one; the UC system; the "public Ivys".