Q: Why do we use a stethoscope?
A: For many reasons, and here’s one of them that I will argue is undervalued. And is still at the heart (hint hint) of some ongoing research…
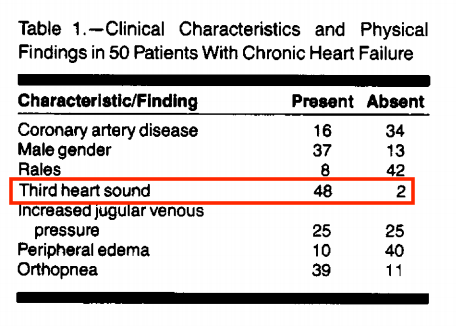
This cohort had quite the notable med regimen: digoxin (84%), furosemide (84%), vasodilators (56%), and milrinone (4%); 39/50 were being evaluated for transplant
A plausible explanation for this observation in chronic (as opposed to acute HF):

https://t.co/UKT9XDf0mc


https://t.co/xWeIhzZ93b


https://t.co/Plaev6fe4q
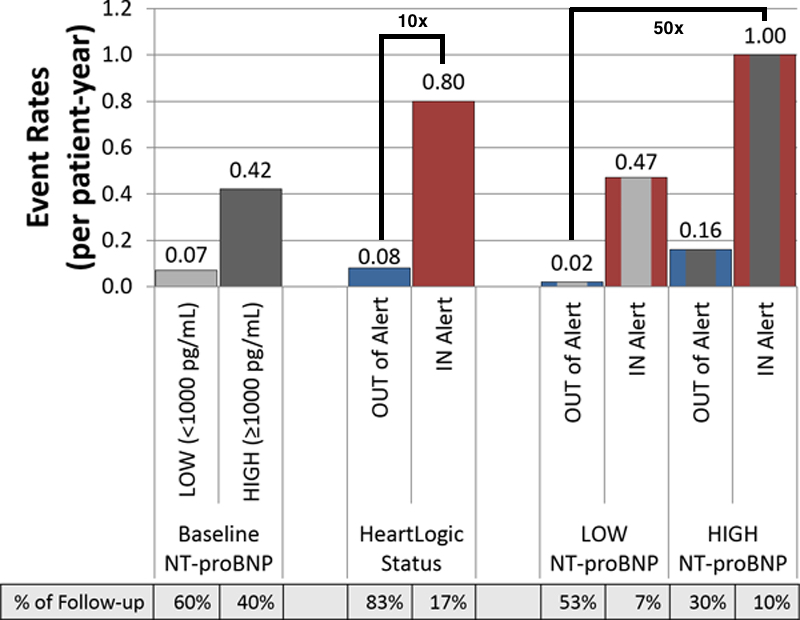
Substratification showed that the lowest risk group (low NT-proBNP and not in alert status) vs. the highest risk group (high NT-proBNP levels and being in alert status), had a 50-fold increased risk of an HF event (1.00/pt-year vs 0.02/pt-year).
Look how far we’ve come from simply placing a stethoscope on a patient - although this is still not obsolete, it has led to some excellent advances over the years.
https://t.co/6jyS3lhfE5
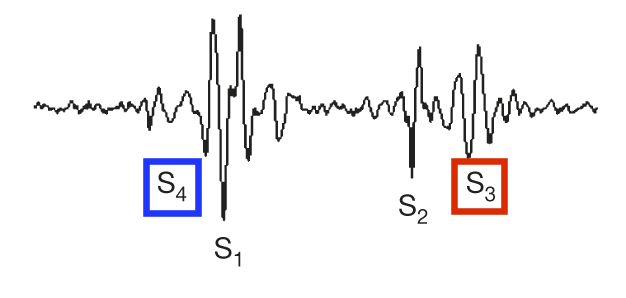
Next exciting thing on the agenda @PennStHershey - using @nanowearinc\u2019s wearable vest with nano-fiber ECG pads and a very sensitive microphone to quantify S3 heart sounds in the inaudible range, to predict HF exacerbations. pic.twitter.com/kmxpRL6a0Y
— Alexander Hajduczok, MD (@AHajduczok) December 19, 2020
Ali, O., Hajduczok, A.G. & Boehmer, J.P. Remote Physiologic Monitoring for Heart Failure. Curr Cardiol Rep 22, 68 (2020).
https://t.co/1bmFVDU4Ij
More from Health

No-regret #hydrogen:
Charting early steps for H₂ infrastructure in Europe.
👉Summary of conclusions of a new study by @AgoraEW @AFRY_global @Ma_Deutsch @gnievchenko (1/17)
https://t.co/YA50FA57Em
The idea behind this study is that future hydrogen demand is highly uncertain and we don’t want to spend tens of billions of euros to repurpose a network which won’t be needed. For instance, hydrogen in ground transport is a hotly debated topic https://t.co/RlnqDYVzpr (2/17)
Similar things can be said about heat. 40% of today’s industrial natural gas use in the EU goes to heat below 100°C and therefore is within range of electric heat pumps – whose performance factors far exceed 100%. (3/17)

Even for higher temperatures, a range of power-to-heat (PtH) options can be more energy-efficient than hydrogen and should be considered first. Available PtH technologies can cover all temperature levels needed in industrial production (e.g. electric arc furnace: 3500°C). (4/17)
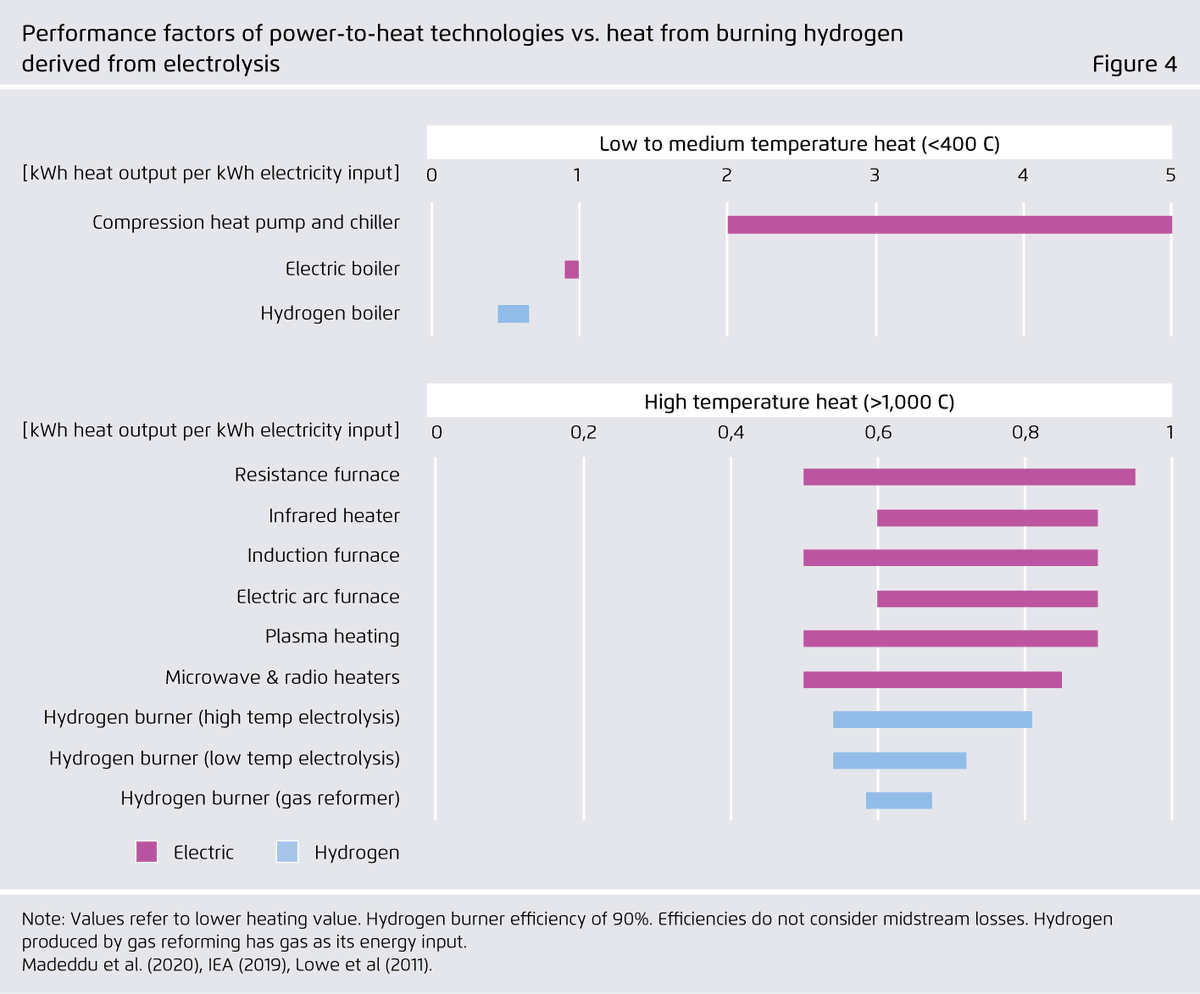
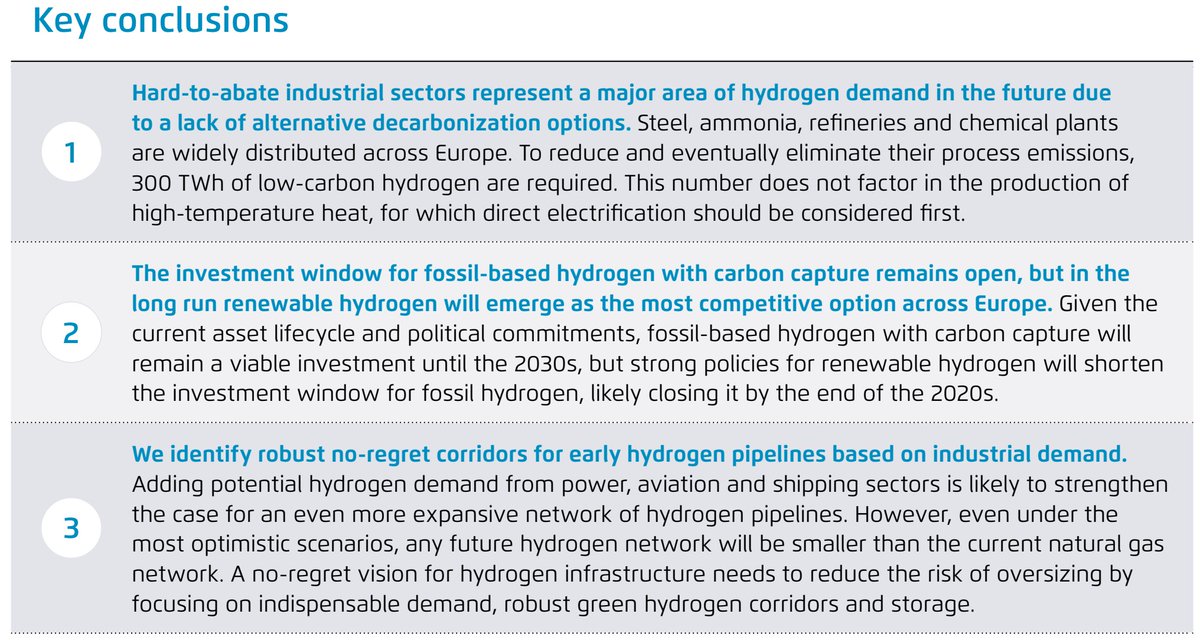
In our view, hydrogen use for feedstock and chemical reactions is the only inescapable source of industrial hydrogen demand in Europe that does not lend itself to electrification. Examples include ammonia, steel, and petrochemical industries. (5/17)
Charting early steps for H₂ infrastructure in Europe.
👉Summary of conclusions of a new study by @AgoraEW @AFRY_global @Ma_Deutsch @gnievchenko (1/17)
https://t.co/YA50FA57Em
The idea behind this study is that future hydrogen demand is highly uncertain and we don’t want to spend tens of billions of euros to repurpose a network which won’t be needed. For instance, hydrogen in ground transport is a hotly debated topic https://t.co/RlnqDYVzpr (2/17)
Similar things can be said about heat. 40% of today’s industrial natural gas use in the EU goes to heat below 100°C and therefore is within range of electric heat pumps – whose performance factors far exceed 100%. (3/17)
Even for higher temperatures, a range of power-to-heat (PtH) options can be more energy-efficient than hydrogen and should be considered first. Available PtH technologies can cover all temperature levels needed in industrial production (e.g. electric arc furnace: 3500°C). (4/17)
In our view, hydrogen use for feedstock and chemical reactions is the only inescapable source of industrial hydrogen demand in Europe that does not lend itself to electrification. Examples include ammonia, steel, and petrochemical industries. (5/17)


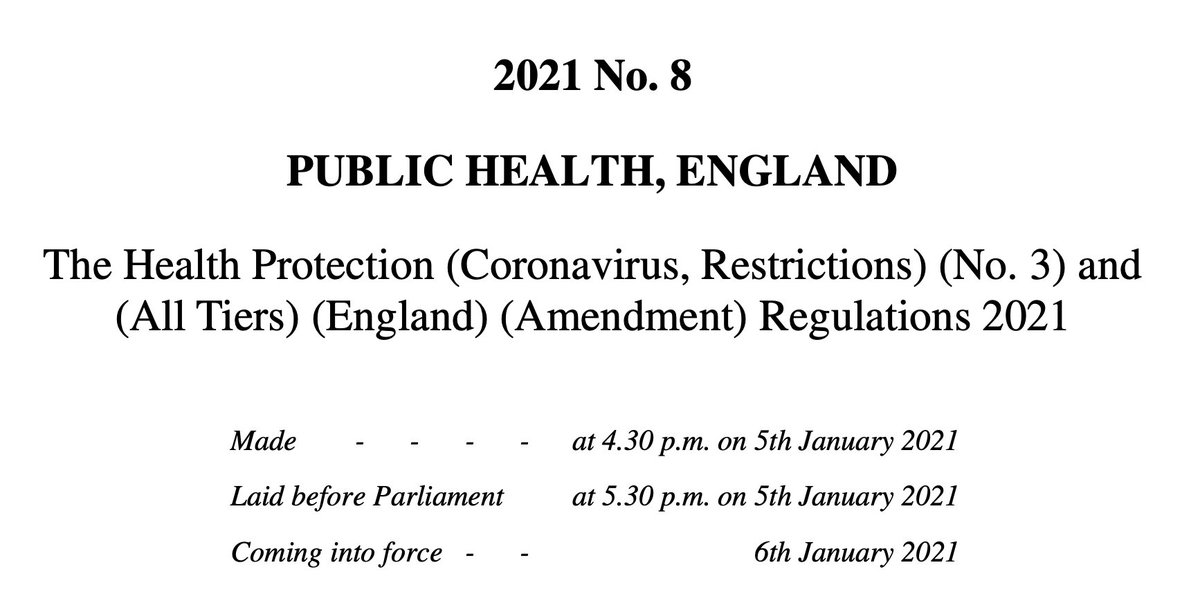
🚨New lockdown regulations just published, in force tomorrow
The Health Protection (Coronavirus, Restrictions) (No. 3) and (All Tiers) (England) (Amendment) Regulations 2021
https://t.co/L5jwlTDaIE
(Thread)
These are not a new set of regulations: they are amendments an old set of regulations
Which we thought were gone! But they are back
Welcome back No.3 regulations
A quick thing before we continue!
I have been analysing these laws for free for 9 months now - if you want to say thanks and have a few £ to spare please give to my @LawCentres fundraiser
They give free legal advice to people who need it
They also amend the All Tiers regulations
Oh god it's all amendments by paragraph references
Basically all of England now in Tier 4 and Tier 4 is amended but not by a huge amount
This really is a terrible way to make laws on the fly - who can possibly understand it?!
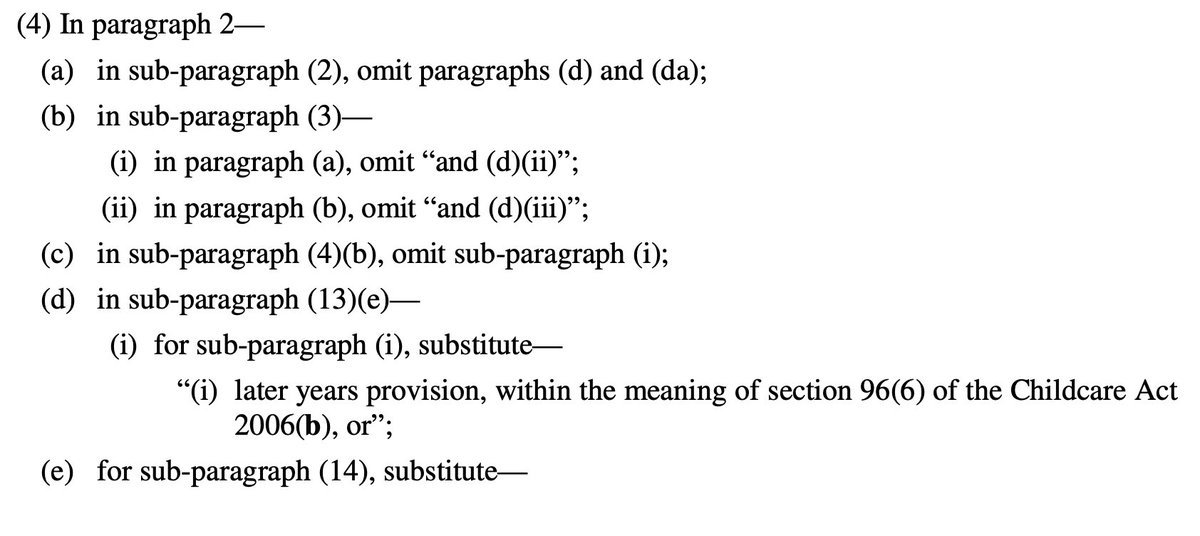
So, to explain, you need 2 documents open if you want to understand what is going on:
All Tiers regulations (Tiers 1-4, 2 December as amended) https://t.co/IraPQ112ak
And amendments https://t.co/L5jwlTDaIE
No sensible way of doing except by track changes, on it now, back soon
The Health Protection (Coronavirus, Restrictions) (No. 3) and (All Tiers) (England) (Amendment) Regulations 2021
https://t.co/L5jwlTDaIE
(Thread)
These are not a new set of regulations: they are amendments an old set of regulations
Which we thought were gone! But they are back
Welcome back No.3 regulations
A quick thing before we continue!
I have been analysing these laws for free for 9 months now - if you want to say thanks and have a few £ to spare please give to my @LawCentres fundraiser
They give free legal advice to people who need it
They also amend the All Tiers regulations
Oh god it's all amendments by paragraph references
Basically all of England now in Tier 4 and Tier 4 is amended but not by a huge amount
This really is a terrible way to make laws on the fly - who can possibly understand it?!
So, to explain, you need 2 documents open if you want to understand what is going on:
All Tiers regulations (Tiers 1-4, 2 December as amended) https://t.co/IraPQ112ak
And amendments https://t.co/L5jwlTDaIE
No sensible way of doing except by track changes, on it now, back soon

You gotta think about this one carefully!
Imagine you go to the doctor and get tested for a rare disease (only 1 in 10,000 people get it.)
The test is 99% effective in detecting both sick and healthy people.
Your test comes back positive.
Are you really sick? Explain below 👇
The most complete answer from every reply so far is from Dr. Lena. Thanks for taking the time and going through
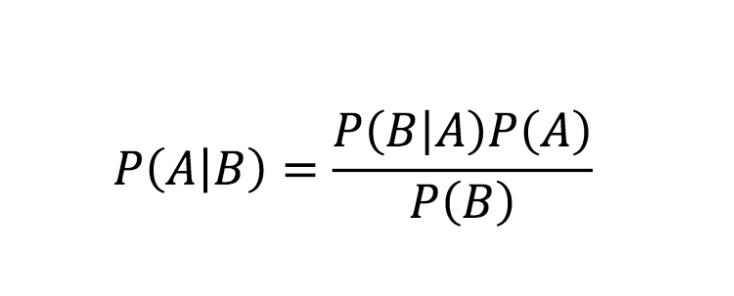
You can get the answer using Bayes' theorem, but let's try to come up with it in a different —maybe more intuitive— way.
👇
Here is what we know:
- Out of 10,000 people, 1 is sick
- Out of 100 sick people, 99 test positive
- Out of 100 healthy people, 99 test negative
Assuming 1 million people take the test (including you):
- 100 of them are sick
- 999,900 of them are healthy
👇
Let's now test both groups, starting with the 100 people sick:
▫️ 99 of them will be diagnosed (correctly) as sick (99%)
▫️ 1 of them is going to be diagnosed (incorrectly) as healthy (1%)
👇
Imagine you go to the doctor and get tested for a rare disease (only 1 in 10,000 people get it.)
The test is 99% effective in detecting both sick and healthy people.
Your test comes back positive.
Are you really sick? Explain below 👇
The most complete answer from every reply so far is from Dr. Lena. Thanks for taking the time and going through
Really doesn\u2019t fit well in a tweet. pic.twitter.com/xN0pAyniFS
— Dr. Lena Sugar \U0001f3f3\ufe0f\u200d\U0001f308\U0001f1ea\U0001f1fa\U0001f1ef\U0001f1f5 (@_jvs) February 18, 2021
You can get the answer using Bayes' theorem, but let's try to come up with it in a different —maybe more intuitive— way.
👇
Here is what we know:
- Out of 10,000 people, 1 is sick
- Out of 100 sick people, 99 test positive
- Out of 100 healthy people, 99 test negative
Assuming 1 million people take the test (including you):
- 100 of them are sick
- 999,900 of them are healthy
👇
Let's now test both groups, starting with the 100 people sick:
▫️ 99 of them will be diagnosed (correctly) as sick (99%)
▫️ 1 of them is going to be diagnosed (incorrectly) as healthy (1%)
👇