This one is for the real stats folks.
Let's deal with some objections to the deaths after flu vax/deaths after Covid vax comparison.
1) I agree Covid vaccine deaths are probably more likely to be reported than flu vaccine deaths. Are they 900 times more likely? Very doubtful...
More from Health


You gotta think about this one carefully!
Imagine you go to the doctor and get tested for a rare disease (only 1 in 10,000 people get it.)
The test is 99% effective in detecting both sick and healthy people.
Your test comes back positive.
Are you really sick? Explain below 👇
The most complete answer from every reply so far is from Dr. Lena. Thanks for taking the time and going through
You can get the answer using Bayes' theorem, but let's try to come up with it in a different —maybe more intuitive— way.
👇
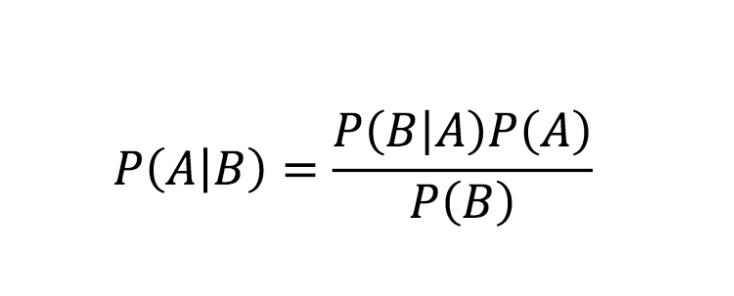
Here is what we know:
- Out of 10,000 people, 1 is sick
- Out of 100 sick people, 99 test positive
- Out of 100 healthy people, 99 test negative
Assuming 1 million people take the test (including you):
- 100 of them are sick
- 999,900 of them are healthy
👇
Let's now test both groups, starting with the 100 people sick:
▫️ 99 of them will be diagnosed (correctly) as sick (99%)
▫️ 1 of them is going to be diagnosed (incorrectly) as healthy (1%)
👇
Imagine you go to the doctor and get tested for a rare disease (only 1 in 10,000 people get it.)
The test is 99% effective in detecting both sick and healthy people.
Your test comes back positive.
Are you really sick? Explain below 👇
The most complete answer from every reply so far is from Dr. Lena. Thanks for taking the time and going through
Really doesn\u2019t fit well in a tweet. pic.twitter.com/xN0pAyniFS
— Dr. Lena Sugar \U0001f3f3\ufe0f\u200d\U0001f308\U0001f1ea\U0001f1fa\U0001f1ef\U0001f1f5 (@_jvs) February 18, 2021
You can get the answer using Bayes' theorem, but let's try to come up with it in a different —maybe more intuitive— way.
👇
Here is what we know:
- Out of 10,000 people, 1 is sick
- Out of 100 sick people, 99 test positive
- Out of 100 healthy people, 99 test negative
Assuming 1 million people take the test (including you):
- 100 of them are sick
- 999,900 of them are healthy
👇
Let's now test both groups, starting with the 100 people sick:
▫️ 99 of them will be diagnosed (correctly) as sick (99%)
▫️ 1 of them is going to be diagnosed (incorrectly) as healthy (1%)
👇