#HDFCAMC - HDFC AMC Elliott wave theory analysis for long time investment - TradingView -
More from TradingView India 🇮🇳
More from Hdfcamc

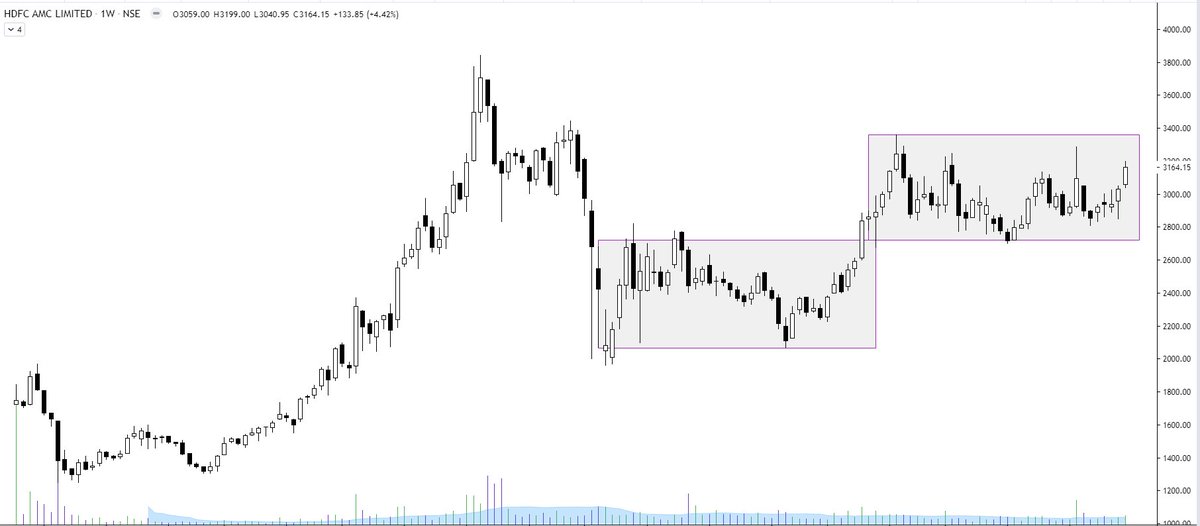

#HDFCAMC
The price picked up towards crossing the horizontal level of 3290 but couldn't hold up.
Got rejected from the wick at 3365; Now the range of 3290-3365 must be broken to head higher towards 3500+
If it fails to do so; We might just see range-based action.
#StockMarket https://t.co/aRKvpy5Eyl
The price picked up towards crossing the horizontal level of 3290 but couldn't hold up.
Got rejected from the wick at 3365; Now the range of 3290-3365 must be broken to head higher towards 3500+
If it fails to do so; We might just see range-based action.
#StockMarket https://t.co/aRKvpy5Eyl
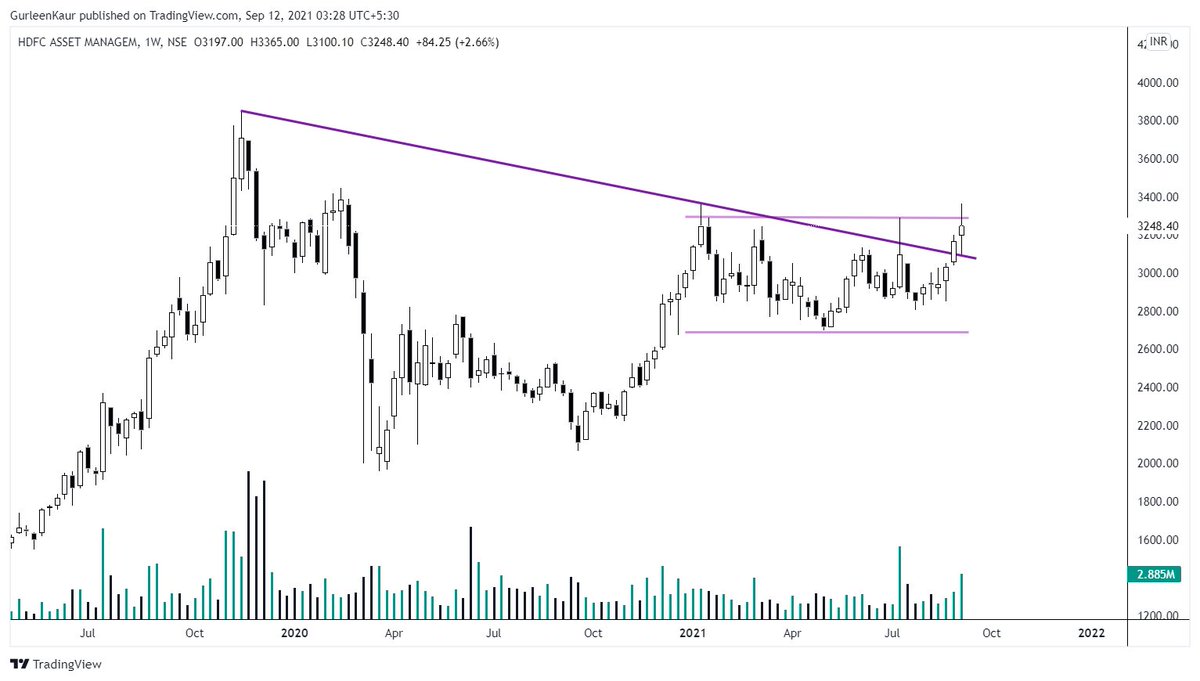
#HDFCAMC
— Gurleen (@GurleenKaur_19) September 6, 2021
Broken past the negative slope of lower highs. Observing the price structure, even the volumes have started picking up and are an increasing pace.
Going further; The script looks good for heading higher. #StockMarket #StocksInFocus pic.twitter.com/OiVwXGh9ee


You May Also Like


Nano Course On Python For Trading
==========================
Module 1
Python makes it very easy to analyze and visualize time series data when you’re a beginner. It's easier when you don't have to install python on your PC (that's why it's a nano course, you'll learn python...
... on the go). You will not be required to install python in your PC but you will be using an amazing python editor, Google Colab Visit https://t.co/EZt0agsdlV
This course is for anyone out there who is confused, frustrated, and just wants this python/finance thing to work!
In Module 1 of this Nano course, we will learn about :
# Using Google Colab
# Importing libraries
# Making a Random Time Series of Black Field Research Stock (fictional)
# Using Google Colab
Intro link is here on YT: https://t.co/MqMSDBaQri
Create a new Notebook at https://t.co/EZt0agsdlV and name it AnythingOfYourChoice.ipynb
You got your notebook ready and now the game is on!
You can add code in these cells and add as many cells as you want
# Importing Libraries
Imports are pretty standard, with a few exceptions.
For the most part, you can import your libraries by running the import.
Type this in the first cell you see. You need not worry about what each of these does, we will understand it later.