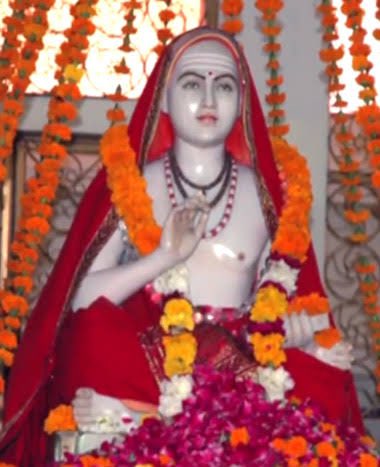
ADI SHANKAR AND SRI TOTAKACHARYA
Adi Shankaracharya chose his disciple Totakacharya to be the first head of the Math at Joshimath.
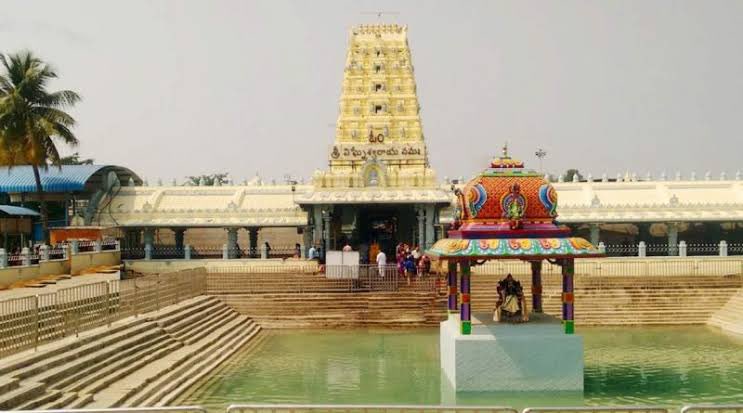
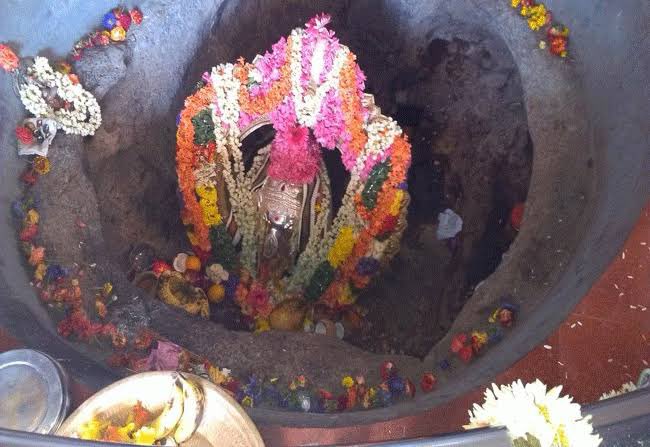
The Narsingh Mandir (Mandir of Sri Narasimha) in Joshimath is one of the 108 Divyadesams and also the home of Badrinath during the winter months.
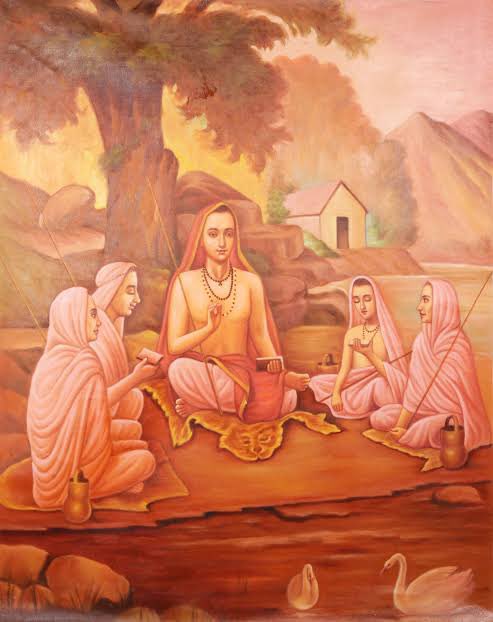
Totakacharya was earlier a boy named ‘Giri’ and a devout disciple of Adi Shankaracharya. Unlike others, he was not known to be an expert in Shastras but his dedication to his Guru was complete and he used to listen to His discourses with utmost faith and devotion.
@SriRamya21
One morning as Adi Shankara and his disciples were getting ready for the discourse, Giri was delayed. The other disciples urged their Guru to commence the lesson on Bramhsutra Bhashya telling him that Giri would anyway not be able to comprehend its deep meaning.
@RajeAiyer
Adi Shankar responded “नायमात्मा प्रवचनेन लभ्यो न मेधया” – Atman cannot be attained through discourses or mere intellect.
He,then, awakened the supreme knowledge in Giri.
Giri spontaneously composed: श्री शङ्करदेशिकाष्टकम् extolling his Guru’s grace.
Adi Shankaracharya granted sanyasa to Giri and gave him the name Totakacharya.
The story of how Giri became Totakacharya is a great example of the importance of faith and devotion in your Guru and not the mere knowledge of the Shastras.
@DetheEsha