
6 January 2020 #MAGAanalysis #2020Treason
Not From Without, From Within
We'll discuss Neon Revolt's 3 articles below. If you haven't, you should read them now. Before we turn to them, I'll offer my own thoughts about this terrible
Even typing, I must pause and look at those words before I hit "Tweet." Not from fear for self.
Those words. Those are stunning even to me.
Even to me? I have never once been a Mike Pence fan. And, I have often judged him more harshly than I cared to express, but I am on record. Not a Pence fan.
Fear does NOT = Knowledge
I do not act on fear. I act on knowledge.
But I note and heed my fears, carefully. I am afraid Neon is right.
For all my work on analysis, I just hadn't seen it that way till today.
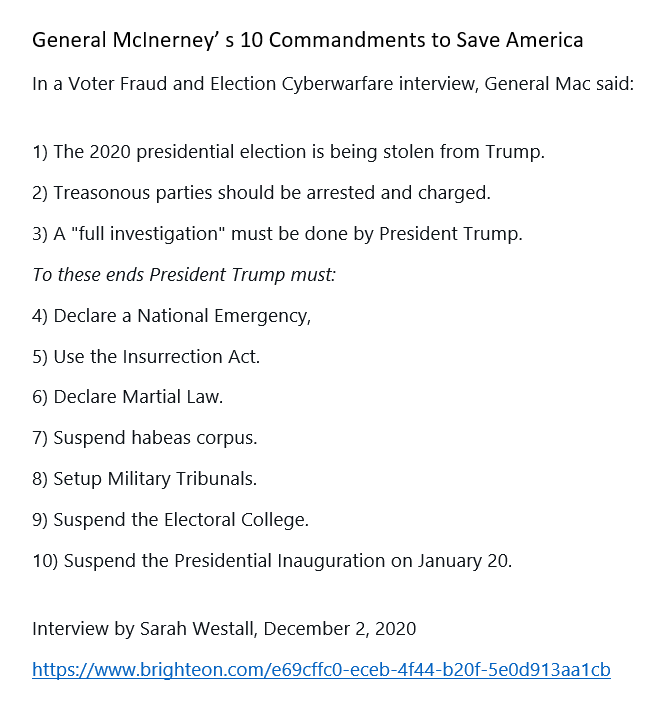
https://t.co/UzxLPIiGDT
1) What do we think?
2) What do we know?
3) What can we prove?
Can we prove it? I'm not read in at that level. Besides, how? Our courts are as corrupt as can be. Where do you prove it?
When We Must Harden Our Hearts and Steel Our Souls
No matter how you cut it, if we wish to save America, there is a battle of one form or another in front of us. There's no getting around that.
Back in a bit...
https://t.co/10eZ9hRYFc
https://t.co/QTcT7iNadR
When I embrace a leader as my guide, I need to understand his thought, knowledge, and proof. And that means slow, careful reading and notation. That's what we turn to now.
"The Democrat Party and its political operatives, with the unwitting aid of “useful idiots” from the
Republican Party, stole the presidential election from Donald J. Trump."
included:
1) Changes in the law approved by State Legislatures;
2) Rule changes and new guidance
initiated by Secretaries of State or other election officials;
3) Court rulings and interventions;
4) and the aggressive use of so-called “public-private partnerships” to commandeer and manipulate the
election process in key Democrat strongholds such as Wayne County, Michigan and Dane County,
Wisconsin.
1) Relaxing mail-in and absentee ballot rules;
2) Sending absentee or mail-in ballots or
3) Applications for such ballots to every voter (universal
mailing);
4) Increasing both the legal and
5) Illegal use of drop boxes;
6) Ballot harvesting; and
7) The use of corrupted voting machines.
1) Relaxation of ID verification;
2) Reduced signature matching requirements;
3) Illegally counting naked ballots to increase ballot curing –
4) Both legal and illegal; and
5) Reduced poll watching and observing.
More from Pasquale "Pat" Scopelliti
More from Government


Abbott is pushing a lie to protect incompetence. There is no Federal oversight of the Texas Grid, ergo fewer regulations (sound familiar) - so point one: state legislature needs reform. 2/
2. Point 2: there were clear signs the grid would get overloaded under extreme cold conditions. Why? Due to a vacuum of regulations mandating winterization of turbines and power generators. This from sources, in Texas!
3. Point 3: Of the power shortfall that hit Texas, over 80% was due to problems at coal and gas fired plants. Power generators were just not winterized. Decisions to do so have been ignored since the 1990s.
4. Point 4: these are winterized wind turbines in Denmark. The ocean is frozen. The turbines are generating.
5. #Texas| the main issue is: catastrophic governance at the State level (no Federal oversight of the Texas grid) failing to allocate funding to winterise the Natural Gas, Coal and Wind Turbine elements that contribute to the grid. (~ 80/20
Texas Gov. Abbott blames solar and wind for the blackouts in his state and says "this shows how the Green New Deal would be a deadly deal for the United States of America" pic.twitter.com/YfVwa3YRZQ
— Andrew Lawrence (@ndrew_lawrence) February 17, 2021
2. Point 2: there were clear signs the grid would get overloaded under extreme cold conditions. Why? Due to a vacuum of regulations mandating winterization of turbines and power generators. This from sources, in Texas!
3. Point 3: Of the power shortfall that hit Texas, over 80% was due to problems at coal and gas fired plants. Power generators were just not winterized. Decisions to do so have been ignored since the 1990s.
4. Point 4: these are winterized wind turbines in Denmark. The ocean is frozen. The turbines are generating.
Same thing in Denmark. It's cold enough here that the ocean is frozen and yet look at those reliable windmills just chugging along. pic.twitter.com/1NTljk7hk9
— Elizabeth Gummere (@BethGummere) February 17, 2021
5. #Texas| the main issue is: catastrophic governance at the State level (no Federal oversight of the Texas grid) failing to allocate funding to winterise the Natural Gas, Coal and Wind Turbine elements that contribute to the grid. (~ 80/20
You May Also Like

#sculpture #story -
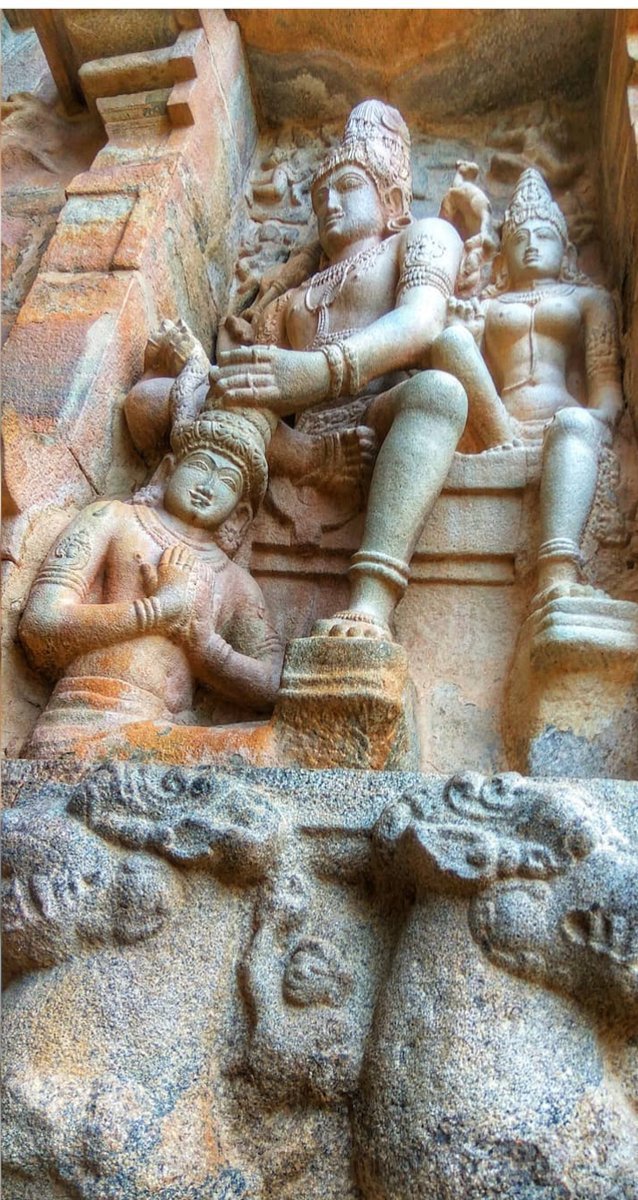
Chandesha-Anugraha Murti - One of the Sculpture in Brihadeshwara Temple at Gangaikonda Cholapuram - built by Raja Rajendra Chola I
This Sculpture depicts Bhagwan Shiva along with Devi Paravathi blessing Chandeshwara - one of the 63 Nayanmars.
#Thread
Chandeshwara/Chandikeshwara is regarded as custodian of Shiva Temple's wealth&most of Shiva temples in South India has separate sannathi for him.
His bhakti for Bhagwan Shiva elevated him as one of foremost among Nayanmars.
He gave importance to Shiva Pooja&protection of cows.
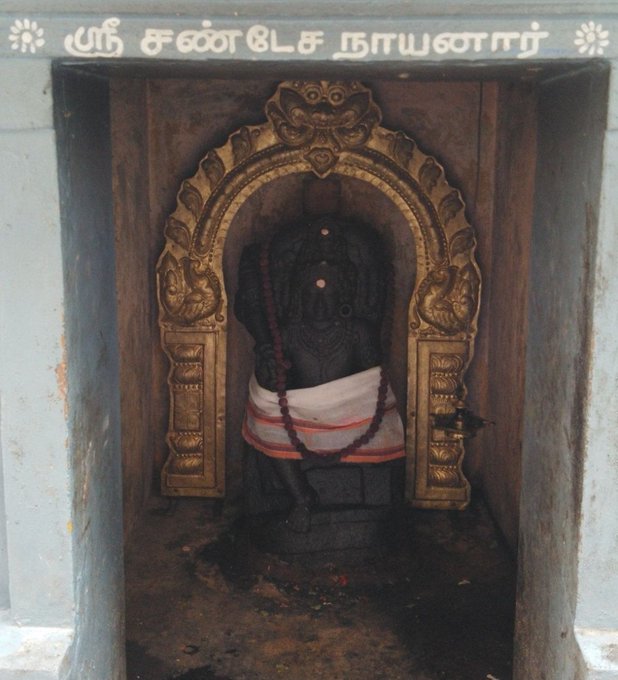
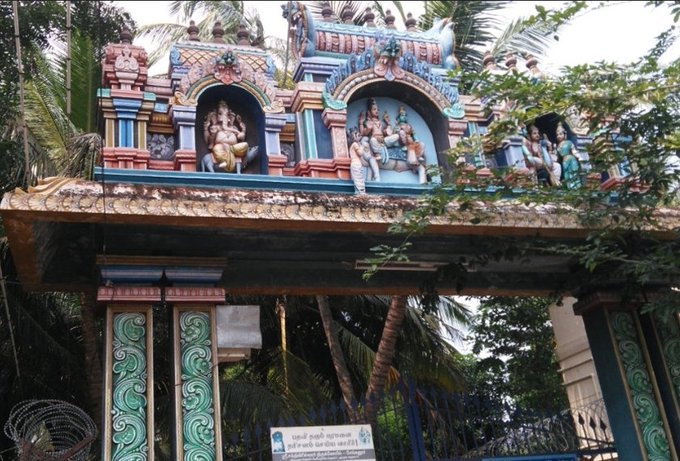
There are series of paintings, illustrating the #story of Chandikeshwar in the premises of
Sri Sathiyagireeswarar #Temple at Seinganur,near Kumbakonam,TN
Chandikeshwara's birth name
is Vichara sarman.He was born in the village of Senganur on the banks of River Manni.
His Parent names were Yajnathatan and Pavithrai.
Vichara Sarman was a gifted child and he learnt Vedas and Agamas at a very young age.
He was very devout and would always think about Bhagwan Shiva.
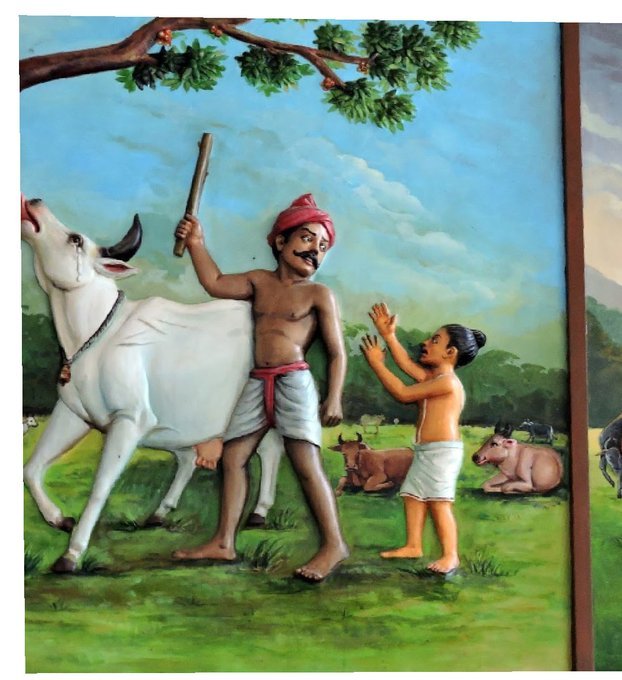
One day he saw a cowherd man brutally assaulting a cow,Vichara Sarman could not tolerate this. He spoke to cowherd: ‘Do you not know that the cow is worshipful & divine? All gods & Devas reside in https://t.co/ElLcI5ppsK it is our duty to protect cows &we should not to harm them.
Chandesha-Anugraha Murti - One of the Sculpture in Brihadeshwara Temple at Gangaikonda Cholapuram - built by Raja Rajendra Chola I
This Sculpture depicts Bhagwan Shiva along with Devi Paravathi blessing Chandeshwara - one of the 63 Nayanmars.
#Thread
Chandeshwara/Chandikeshwara is regarded as custodian of Shiva Temple's wealth&most of Shiva temples in South India has separate sannathi for him.
His bhakti for Bhagwan Shiva elevated him as one of foremost among Nayanmars.
He gave importance to Shiva Pooja&protection of cows.
There are series of paintings, illustrating the #story of Chandikeshwar in the premises of
Sri Sathiyagireeswarar #Temple at Seinganur,near Kumbakonam,TN
Chandikeshwara's birth name
is Vichara sarman.He was born in the village of Senganur on the banks of River Manni.
His Parent names were Yajnathatan and Pavithrai.
Vichara Sarman was a gifted child and he learnt Vedas and Agamas at a very young age.
He was very devout and would always think about Bhagwan Shiva.
One day he saw a cowherd man brutally assaulting a cow,Vichara Sarman could not tolerate this. He spoke to cowherd: ‘Do you not know that the cow is worshipful & divine? All gods & Devas reside in https://t.co/ElLcI5ppsK it is our duty to protect cows &we should not to harm them.





fascinated by this man, mario cortellucci, and his outsized influence on ontario and GTA politics. cortellucci, who lives in vaughan and ran as a far-right candidate for the italian senate back in 2018 - is a major ford donor...
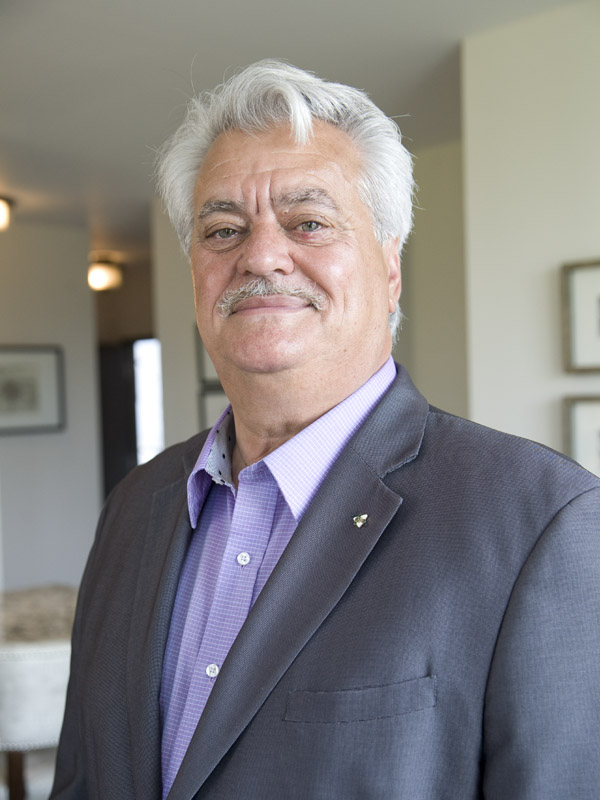
his name might sound familiar because the new cortellucci vaughan hospital at mackenzie health, the one doug ford has been touting lately as a covid-centric facility, is named after him and his family
but his name also pops up in a LOT of other ford projects. for instance - he controls the long term lease on big parts of toronto's portlands... where doug ford once proposed building an nfl stadium and monorail... https://t.co/weOMJ51bVF
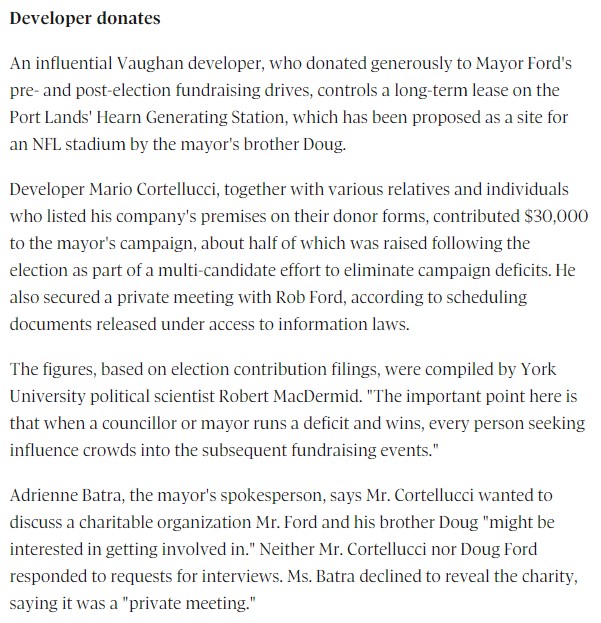
cortellucci, who is a developer, also owns a large chunk of the greenbelt. doug ford's desire to develop the greenbelt has been
and late last year he rolled back the mandate of conservation authorities there, prompting the resignations of several members of the greenbelt advisory
his name might sound familiar because the new cortellucci vaughan hospital at mackenzie health, the one doug ford has been touting lately as a covid-centric facility, is named after him and his family
but his name also pops up in a LOT of other ford projects. for instance - he controls the long term lease on big parts of toronto's portlands... where doug ford once proposed building an nfl stadium and monorail... https://t.co/weOMJ51bVF
cortellucci, who is a developer, also owns a large chunk of the greenbelt. doug ford's desire to develop the greenbelt has been
and late last year he rolled back the mandate of conservation authorities there, prompting the resignations of several members of the greenbelt advisory