One year ago, the US targeted killing of #Iran’s #GeneralSoleimani in #Iraq became the first known incident outside the context of a declared conflict in which a State invoked self-defence as justification for an attack against a State-actor.
More from Government


Parents in cities, please pay attention to the reopening details from the Whitehouse.
Biden says "small classes". What we need to understand is how they plant to accomplish this.
Through "childcare programs in schools". We see this all over states w/ closed schools.
We need to grasp that the AFT, NEA, & local unions are systematically working to decouple education from childcare.
Their vision is your child sitting on a device all day, watched by a childcare worker, being "taught" from a Teacher working from
This isn't a paranoid conspiracy theory - it is already happening in the majority of districts across the US where schools are closed.
"Learning Hubs" open, supervised by childcare workers, sometimes in the same "unsafe" school
There is NO OTHER WAY to get "small classes" without Hybrid + wraparound childcare. Your child will spend 2-3 days per WEEK supervised by low wage workers and sitting on a laptop.
Here's
Fairfax,
Biden says "small classes". What we need to understand is how they plant to accomplish this.
Through "childcare programs in schools". We see this all over states w/ closed schools.
Today, our first working day, @JoeBiden signed an Executive Order on safely reopening childcare programs in schools - @DrBiden pic.twitter.com/J4vZk5ZAaS
— AFT (@AFTunion) January 21, 2021
We need to grasp that the AFT, NEA, & local unions are systematically working to decouple education from childcare.
Their vision is your child sitting on a device all day, watched by a childcare worker, being "taught" from a Teacher working from
This isn't a paranoid conspiracy theory - it is already happening in the majority of districts across the US where schools are closed.
"Learning Hubs" open, supervised by childcare workers, sometimes in the same "unsafe" school
There is NO OTHER WAY to get "small classes" without Hybrid + wraparound childcare. Your child will spend 2-3 days per WEEK supervised by low wage workers and sitting on a laptop.
Here's
Fairfax,

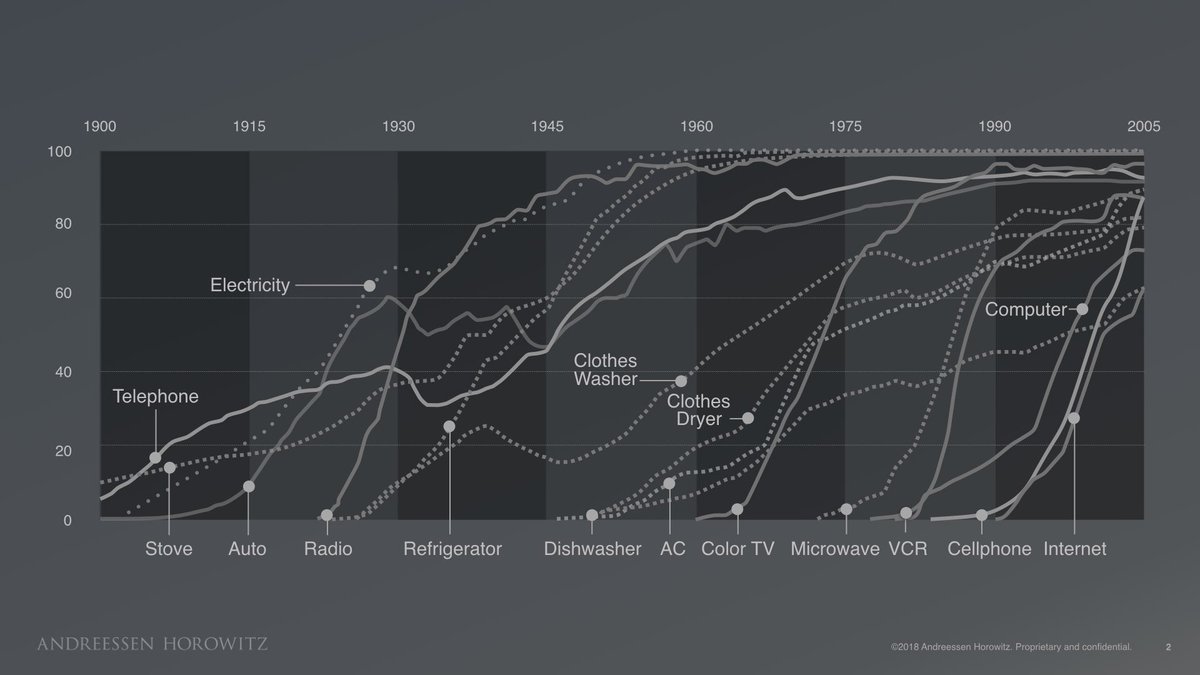
Which metric is a better predictor of the severity of the fall surge in US states?
1) Margin of Democrat victory in Nov 2020 election
or
2) % infected through Sep 1, 2020
Can you guess which plot is which?

The left plot is based on the % infected through Sep 1, 2020. You can see that there is very little correlation with the % infected since Sep 1.
However, there is a *strong* correlation when using the margin of Biden's victory (right).
Infections % from https://t.co/WcXlfxv3Ah.

This is the strongest single variable I've seen in being able to explain the severity of this most recent wave in each state.
Not past infections / existing immunity, population density, racial makeup, latitude / weather / humidity, etc.
But political lean.
One can argue that states that lean Democrat are more likely to implement restrictions/mandates.
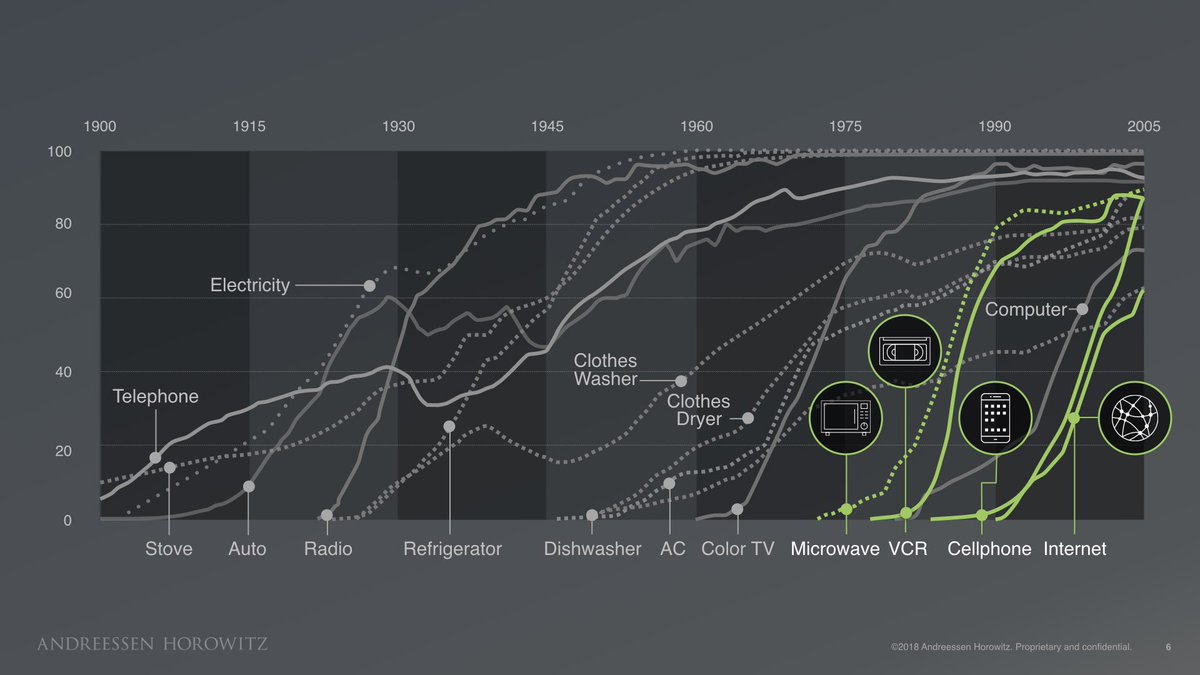
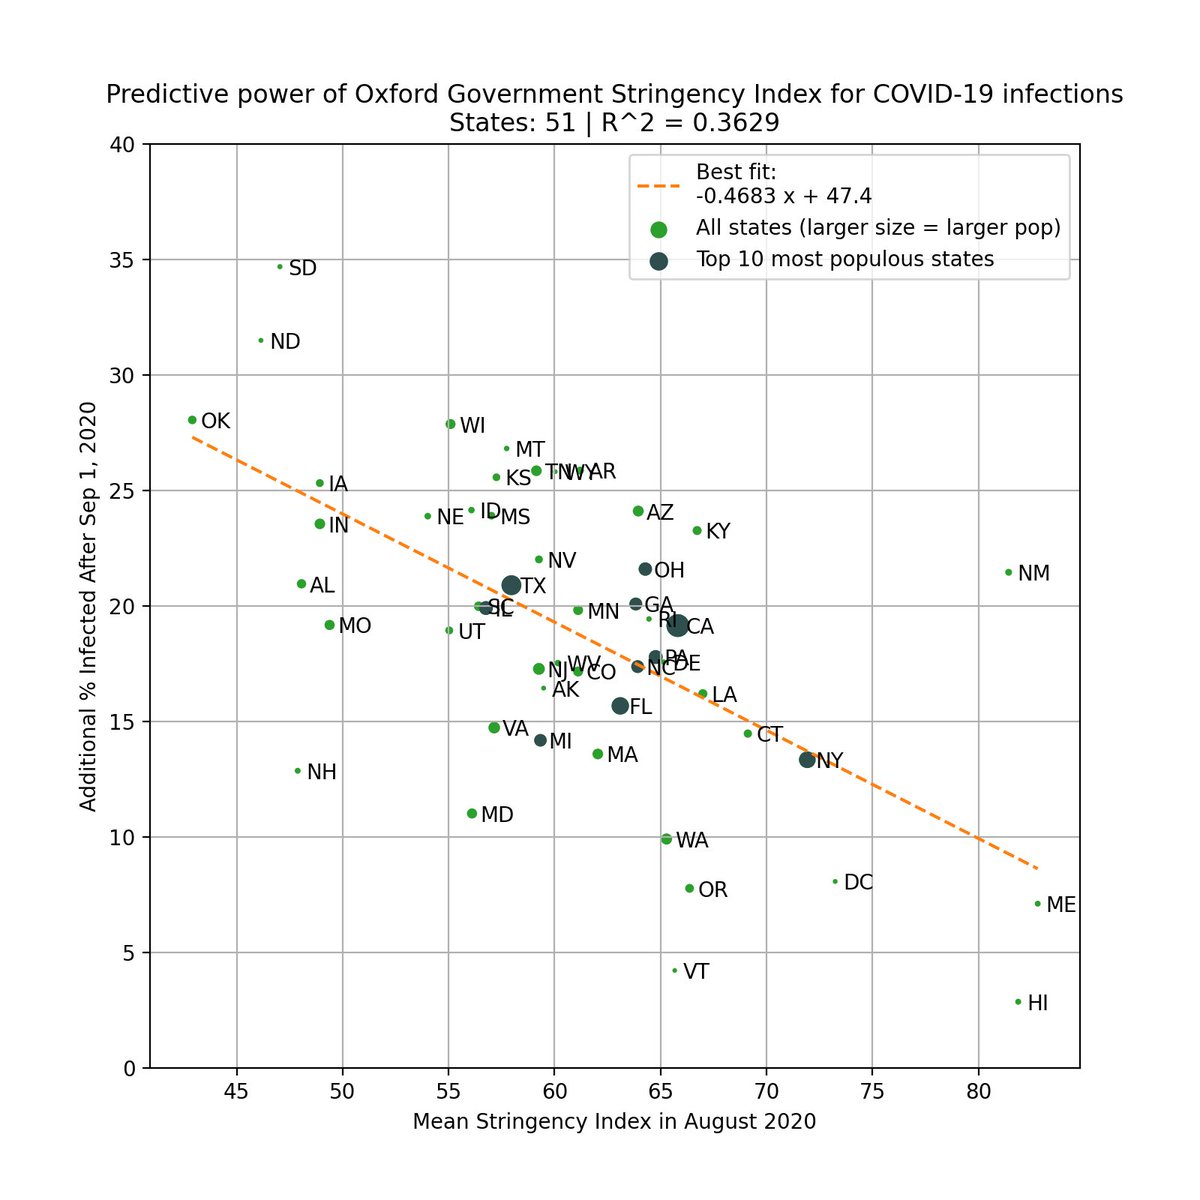
This is valid, so we test this by using the Government Stringency Index made by @UniofOxford.
We also see a correlation, but it's weaker (R^2=0.36 vs 0.50).
https://t.co/BxBBKwW6ta
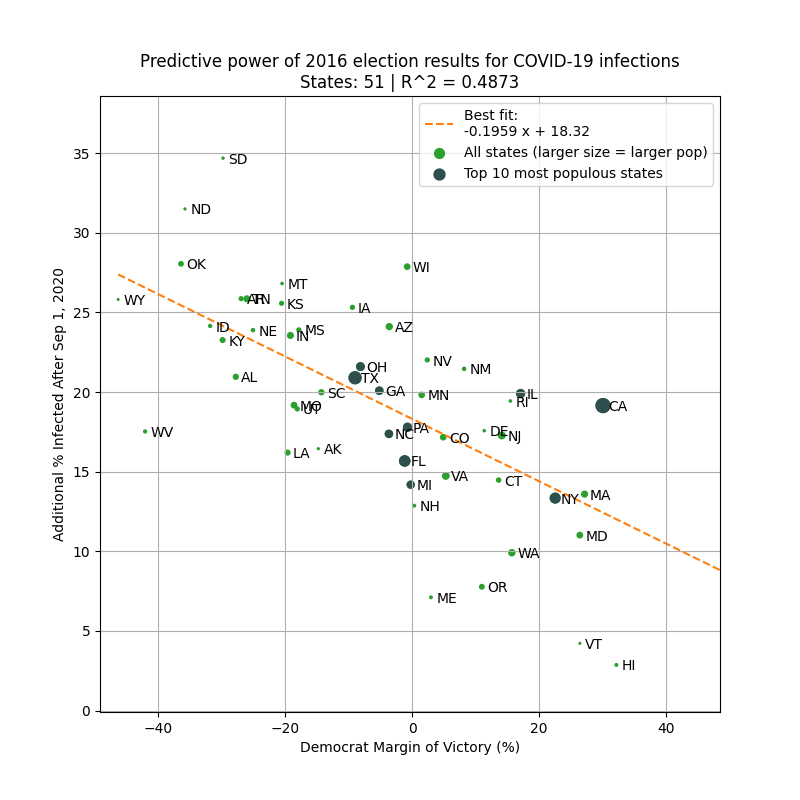
To avoid look-ahead bias/confounding variables, here is the same analysis but using 2016 margin of victory as the predictor. Similar results.
This basically says that 2016 election results is a better predictor of the severity of the fall wave than intervention levels in 2020!
1) Margin of Democrat victory in Nov 2020 election
or
2) % infected through Sep 1, 2020
Can you guess which plot is which?
The left plot is based on the % infected through Sep 1, 2020. You can see that there is very little correlation with the % infected since Sep 1.
However, there is a *strong* correlation when using the margin of Biden's victory (right).
Infections % from https://t.co/WcXlfxv3Ah.
This is the strongest single variable I've seen in being able to explain the severity of this most recent wave in each state.
Not past infections / existing immunity, population density, racial makeup, latitude / weather / humidity, etc.
But political lean.
One can argue that states that lean Democrat are more likely to implement restrictions/mandates.
This is valid, so we test this by using the Government Stringency Index made by @UniofOxford.
We also see a correlation, but it's weaker (R^2=0.36 vs 0.50).
https://t.co/BxBBKwW6ta
To avoid look-ahead bias/confounding variables, here is the same analysis but using 2016 margin of victory as the predictor. Similar results.
This basically says that 2016 election results is a better predictor of the severity of the fall wave than intervention levels in 2020!
You May Also Like


I hate when I learn something new (to me) & stunning about the Jeff Epstein network (h/t MoodyKnowsNada.)
Where to begin?
So our new Secretary of State Anthony Blinken's stepfather, Samuel Pisar, was "longtime lawyer and confidant of...Robert Maxwell," Ghislaine Maxwell's Dad.

"Pisar was one of the last people to speak to Maxwell, by phone, probably an hour before the chairman of Mirror Group Newspapers fell off his luxury yacht the Lady Ghislaine on 5 November, 1991." https://t.co/DAEgchNyTP
OK, so that's just a coincidence. Moving on, Anthony Blinken "attended the prestigious Dalton School in New York City"...wait, what? https://t.co/DnE6AvHmJg
Dalton School...Dalton School...rings a
Oh that's right.
The dad of the U.S. Attorney General under both George W. Bush & Donald Trump, William Barr, was headmaster of the Dalton School.
Donald Barr was also quite a
I'm not going to even mention that Blinken's stepdad Sam Pisar's name was in Epstein's "black book."
Lots of names in that book. I mean, for example, Cuomo, Trump, Clinton, Prince Andrew, Bill Cosby, Woody Allen - all in that book, and their reputations are spotless.
Where to begin?
So our new Secretary of State Anthony Blinken's stepfather, Samuel Pisar, was "longtime lawyer and confidant of...Robert Maxwell," Ghislaine Maxwell's Dad.
"Pisar was one of the last people to speak to Maxwell, by phone, probably an hour before the chairman of Mirror Group Newspapers fell off his luxury yacht the Lady Ghislaine on 5 November, 1991." https://t.co/DAEgchNyTP
OK, so that's just a coincidence. Moving on, Anthony Blinken "attended the prestigious Dalton School in New York City"...wait, what? https://t.co/DnE6AvHmJg
Dalton School...Dalton School...rings a
Oh that's right.
The dad of the U.S. Attorney General under both George W. Bush & Donald Trump, William Barr, was headmaster of the Dalton School.
Donald Barr was also quite a
Donald Barr had a way with words. pic.twitter.com/JdRBwXPhJn
— Rudy Havenstein, listening to Nas all day. (@RudyHavenstein) September 17, 2020
I'm not going to even mention that Blinken's stepdad Sam Pisar's name was in Epstein's "black book."
Lots of names in that book. I mean, for example, Cuomo, Trump, Clinton, Prince Andrew, Bill Cosby, Woody Allen - all in that book, and their reputations are spotless.