
In 2009, I studied the history of the FBI/CIA and also the Hitler regime (research for a book). I expected it to be a dull errand, not a horrific realization that the evil methods of operation of US agencies were often indistinguishable in their actions from the N regime. AND...
The same is true if a society believes "there's never any justice anyway, so I no longer care... they're ALL evil".
a. Tolerate and accept evil actions that they use to frame/blackmail with
b. Develop apathy toward all evil, accepting, giving up on the fight
Therefore, in their best interest to
So... sometimes...
Agencies and others who appear to be fighting FOR the victims, are actually
In this way, the blackmail methods and materials that they've invested in, still give a solid return on that investment,
"Say this"
"Do this"
And they will.
The moment the blackmail material loses power, the Controllers lose power over their puppets.
In all of this, the victims of heinous crimes are
I'm writing this thread to share my conclusions after researching old records, in actual physical libraries, old dusty books no one reads.
Bad things that violate human rights & universally evil were already proven and documented to have been done by agencies.
The evil progressed because society progressed.
What's a blackmailer to do then?
What's still off limits?
And... it has a logical path.
It did happen.
There has been very little justice over the years.
The situation is ongoing.
THAT is the status, and many know it.
Blackmail material of the past, which may have been something as simple as a photograph of a quaint peck on the cheek as assumed proof of adultery,
However...
the blackmailers now
the downside to them is that there are too many operators and with many players, there will be stupid ones who mess things up.
They can't keep up with all of the mistakes.

More from Government


Long thread: Because I couldn’t find anything comprehensive, I’m just going to post everything I’ve seen in the news/Twitter about Trump’s activities related to the Jan 6th insurrection. I think the timing & context of his actions/inactions will matter a lot for a senate trial.
12/12: The earlier DC protest over the electoral college vote during clearly inspired Jan 6th. On Dec 12th, he tweeted: “Wow! Thousands of people forming in Washington (D.C.) for Stop the Steal. Didn’t know about this, but I’ll be seeing them! #MAGA.”
12/19: Trump announces the Jan. 6th event by tweeting, “Big protest in D.C. on January 6th. Be there, will be wild!” Immediately, insurrectionists begin to discuss the “Wild Protest.” Just 2 days later, this UK political analyst predicts the violence
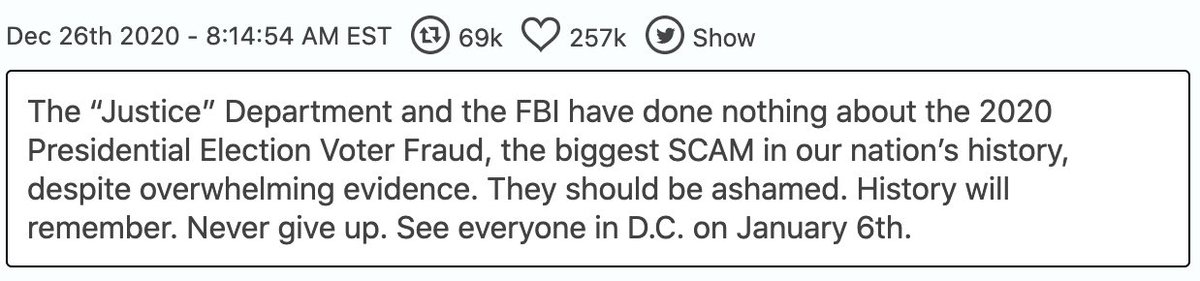
12/26-27: Trump announces his participation on Twitter. On Dec. 29, the FBI sends out a nationwide bulletin warning legislatures about attacks https://t.co/Lgl4yk5aO1
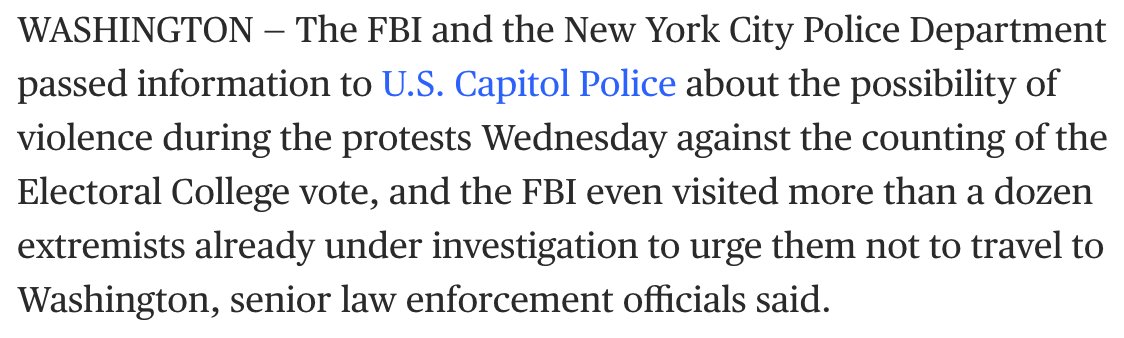
1/1: Trump tweets the time of his protest. Then he retweets “The calvary is coming” on Jan. 6!” Sounds like a war? About this time, the FBI begins visiting right wing extremists to tell them not to go--does the FBI tell the president? https://t.co/3OxnB2AHdr
12/12: The earlier DC protest over the electoral college vote during clearly inspired Jan 6th. On Dec 12th, he tweeted: “Wow! Thousands of people forming in Washington (D.C.) for Stop the Steal. Didn’t know about this, but I’ll be seeing them! #MAGA.”
Jumping in for @DCist/@wamu885 this evening. The scene rn coming up 17th Street from BLM Plaza. pic.twitter.com/Fn9aukjEPW
— Matt Blitz (@WhyBlitz) December 12, 2020
12/19: Trump announces the Jan. 6th event by tweeting, “Big protest in D.C. on January 6th. Be there, will be wild!” Immediately, insurrectionists begin to discuss the “Wild Protest.” Just 2 days later, this UK political analyst predicts the violence
On January 6, armed Trumpist militias will be rallying in DC, at Trump's orders. It's highly likely that they'll try to storm the Capitol after it certifies Joe Biden's win. I don't think this has sunk in yet.
— Arieh Kovler (@ariehkovler) December 21, 2020
12/26-27: Trump announces his participation on Twitter. On Dec. 29, the FBI sends out a nationwide bulletin warning legislatures about attacks https://t.co/Lgl4yk5aO1
1/1: Trump tweets the time of his protest. Then he retweets “The calvary is coming” on Jan. 6!” Sounds like a war? About this time, the FBI begins visiting right wing extremists to tell them not to go--does the FBI tell the president? https://t.co/3OxnB2AHdr




Typically excellent piece from @dsquareddigest The exponential insight is especially neat. Think of it a little like fishing...today you can’t export oysters to the EU (because you simply aren’t allowed to), tomorrow you don’t have a fish exporting business (to the EU).
The extremely small minority of people who known anything about this who think that Brexit will be good for the City make a number of arguments which I shall address in turn...
1. They need us more than we need them. This is a variant of the German carmakers argument. And we know how that went...Business will follow the profit opportunity and if that has moved then so will the business...
And what do we mean by us / we. We’re not talking about massed ranks of Euro investing / trading etc blue blooded British institutions.
Au contraire. We’re talking about the London based subs of US, Asian and indeed European capital markets players...As soon as they think the profit opportunity has moved then so will they...it’s a market innit...
London's status as a financial centre isn't as secure as some might think | Dan Davies https://t.co/q9SU7ra4oF
— The Guardian (@guardian) February 13, 2021
The extremely small minority of people who known anything about this who think that Brexit will be good for the City make a number of arguments which I shall address in turn...
1. They need us more than we need them. This is a variant of the German carmakers argument. And we know how that went...Business will follow the profit opportunity and if that has moved then so will the business...
And what do we mean by us / we. We’re not talking about massed ranks of Euro investing / trading etc blue blooded British institutions.
Au contraire. We’re talking about the London based subs of US, Asian and indeed European capital markets players...As soon as they think the profit opportunity has moved then so will they...it’s a market innit...

You May Also Like


Margatha Natarajar murthi - Uthirakosamangai temple near Ramanathapuram,TN
#ArudraDarisanam
Unique Natarajar made of emerlad is abt 6 feet tall.
It is always covered with sandal paste.Only on Thriuvadhirai Star in month Margazhi-Nataraja can be worshipped without sandal paste.

After removing the sandal paste,day long rituals & various abhishekam will be https://t.co/e1Ye8DrNWb day Maragatha Nataraja sannandhi will be closed after anointing the murthi with fresh sandal paste.Maragatha Natarajar is covered with sandal paste throughout the year

as Emerald has scientific property of its molecules getting disturbed when exposed to light/water/sound.This is an ancient Shiva temple considered to be 3000 years old -believed to be where Bhagwan Shiva gave Veda gyaana to Parvati Devi.This temple has some stunning sculptures.

#ArudraDarisanam
Unique Natarajar made of emerlad is abt 6 feet tall.
It is always covered with sandal paste.Only on Thriuvadhirai Star in month Margazhi-Nataraja can be worshipped without sandal paste.
After removing the sandal paste,day long rituals & various abhishekam will be https://t.co/e1Ye8DrNWb day Maragatha Nataraja sannandhi will be closed after anointing the murthi with fresh sandal paste.Maragatha Natarajar is covered with sandal paste throughout the year
as Emerald has scientific property of its molecules getting disturbed when exposed to light/water/sound.This is an ancient Shiva temple considered to be 3000 years old -believed to be where Bhagwan Shiva gave Veda gyaana to Parvati Devi.This temple has some stunning sculptures.





My top 10 tweets of the year
A thread 👇
https://t.co/xj4js6shhy
https://t.co/b81zoW6u1d
https://t.co/1147it02zs
https://t.co/A7XCU5fC2m
A thread 👇
https://t.co/xj4js6shhy
Entrepreneur\u2019s mind.
— James Clear (@JamesClear) August 22, 2020
Athlete\u2019s body.
Artist\u2019s soul.
https://t.co/b81zoW6u1d
When you choose who to follow on Twitter, you are choosing your future thoughts.
— James Clear (@JamesClear) October 3, 2020
https://t.co/1147it02zs
Working on a problem reduces the fear of it.
— James Clear (@JamesClear) August 30, 2020
It\u2019s hard to fear a problem when you are making progress on it\u2014even if progress is imperfect and slow.
Action relieves anxiety.
https://t.co/A7XCU5fC2m
We often avoid taking action because we think "I need to learn more," but the best way to learn is often by taking action.
— James Clear (@JamesClear) September 23, 2020