Is the European Union really being unreasonable over the City of London?
Or are we seeing an inevitable consequence of a Brexit that prioritised sovereignty over financial services?
A thread…🧵💵🏦🇬🇧🇪🇺
To some extent yes – especially true among French.
But don’t discount the financial stability concerns, especially since UK ministers have said they intend to use Brexit to diverge on regulation...6/
When the UK was in the EU both co-operated to determine financial regulation.
Now there’s no institutional mechanism to force co-operation, build trust, ensure enforcement etc...8/

More from Government


🧵⬇️1. Fb is LifeLog, LifeLog is Darpa, and DARPA is a Enterprise Run by CIA... Well... Past President... Big Tech, Big Pharma, MSM, HOLLYWOOD, DC...
Past Presidents....Zuckerberg, Gates...
All C_A... the Family business.... The company...
2. Past Presidents....Zuckerberg, Gates...
All C_A... the Family business.... The company...The Farm.... all C_A assets... most of them related by blood, business, or marriage...

3. "The individual is handicapped by coming face-to-face with a conspiracy so monstrous he cannot believe it exists. The American mind simply has not come to a realization of the evil which has been introduced into our midst." - J. Edgar Hoover

4. diff. names & faces.... Monsters that lurk in the Shadows. Swamp, Deep State, Establishment, Globalist Elite Cabal...
Shall we go back...How far back...

5. I know these monsters... it's when I try to explain them to others is when I run into a problem.This is why I'm better at retweeting and compiling. I never know where to start... Everytime I try to thread, i end up w/ a messy monstrous web.I'm better at helping others thread.

Past Presidents....Zuckerberg, Gates...
All C_A... the Family business.... The company...
BREAKING\u2014 \u201cThis \u2018SHADOW GOVERNMENT\u2019 had a huge hand in running the show on Nov. 3 and you may have not known it\u201d says attorney Phil Kine. @newsmax pic.twitter.com/8ypASTEA1Z
— White Rabbit News \u277c (@WhiteRabbitNN) December 17, 2020
2. Past Presidents....Zuckerberg, Gates...
All C_A... the Family business.... The company...The Farm.... all C_A assets... most of them related by blood, business, or marriage...
3. "The individual is handicapped by coming face-to-face with a conspiracy so monstrous he cannot believe it exists. The American mind simply has not come to a realization of the evil which has been introduced into our midst." - J. Edgar Hoover
4. diff. names & faces.... Monsters that lurk in the Shadows. Swamp, Deep State, Establishment, Globalist Elite Cabal...
Shall we go back...How far back...
5. I know these monsters... it's when I try to explain them to others is when I run into a problem.This is why I'm better at retweeting and compiling. I never know where to start... Everytime I try to thread, i end up w/ a messy monstrous web.I'm better at helping others thread.


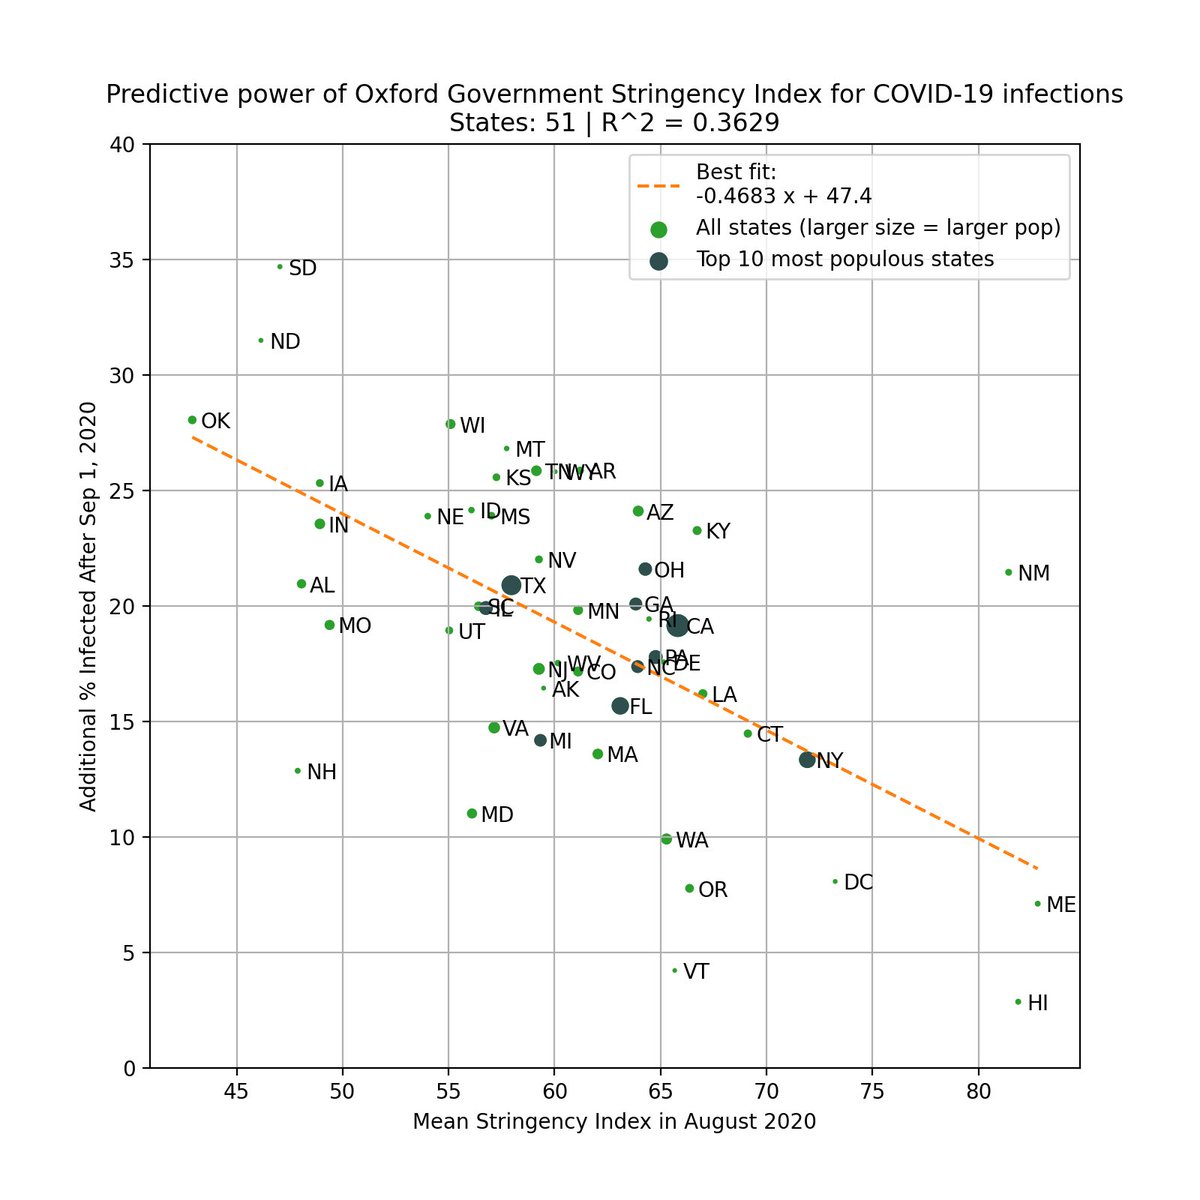
Which metric is a better predictor of the severity of the fall surge in US states?
1) Margin of Democrat victory in Nov 2020 election
or
2) % infected through Sep 1, 2020
Can you guess which plot is which?

The left plot is based on the % infected through Sep 1, 2020. You can see that there is very little correlation with the % infected since Sep 1.
However, there is a *strong* correlation when using the margin of Biden's victory (right).
Infections % from https://t.co/WcXlfxv3Ah.

This is the strongest single variable I've seen in being able to explain the severity of this most recent wave in each state.
Not past infections / existing immunity, population density, racial makeup, latitude / weather / humidity, etc.
But political lean.
One can argue that states that lean Democrat are more likely to implement restrictions/mandates.
This is valid, so we test this by using the Government Stringency Index made by @UniofOxford.
We also see a correlation, but it's weaker (R^2=0.36 vs 0.50).
https://t.co/BxBBKwW6ta
To avoid look-ahead bias/confounding variables, here is the same analysis but using 2016 margin of victory as the predictor. Similar results.
This basically says that 2016 election results is a better predictor of the severity of the fall wave than intervention levels in 2020!
1) Margin of Democrat victory in Nov 2020 election
or
2) % infected through Sep 1, 2020
Can you guess which plot is which?
The left plot is based on the % infected through Sep 1, 2020. You can see that there is very little correlation with the % infected since Sep 1.
However, there is a *strong* correlation when using the margin of Biden's victory (right).
Infections % from https://t.co/WcXlfxv3Ah.
This is the strongest single variable I've seen in being able to explain the severity of this most recent wave in each state.
Not past infections / existing immunity, population density, racial makeup, latitude / weather / humidity, etc.
But political lean.
One can argue that states that lean Democrat are more likely to implement restrictions/mandates.
This is valid, so we test this by using the Government Stringency Index made by @UniofOxford.
We also see a correlation, but it's weaker (R^2=0.36 vs 0.50).
https://t.co/BxBBKwW6ta
To avoid look-ahead bias/confounding variables, here is the same analysis but using 2016 margin of victory as the predictor. Similar results.
This basically says that 2016 election results is a better predictor of the severity of the fall wave than intervention levels in 2020!
You May Also Like


To people who are under the impression that you can get rich quickly by working on an app, here are the stats for https://t.co/az8F12pf02
📈 ~12000 vistis
☑️ 109 transactions
💰 353€ profit (285 after tax)
I have spent 1.5 months on this app. You can make more $ in 2 days.
🤷♂️

I'm still happy that I launched a paid app bcs it involved extra work:
- backend for processing payments (+ permissions, webhooks, etc)
- integration with payment processor
- UI for license activation in Electron
- machine activation limit
- autoupdates
- mailgun emails
etc.
These things seemed super scary at first. I always thought it was way too much work and something would break. But I'm glad I persisted. So far the only problem I have is that mailgun is not delivering the license keys to certain domains like https://t.co/6Bqn0FUYXo etc. 👌
omg I just realized that me . com is an Apple domain, of course something wouldn't work with these dicks
📈 ~12000 vistis
☑️ 109 transactions
💰 353€ profit (285 after tax)
I have spent 1.5 months on this app. You can make more $ in 2 days.
🤷♂️
I'm still happy that I launched a paid app bcs it involved extra work:
- backend for processing payments (+ permissions, webhooks, etc)
- integration with payment processor
- UI for license activation in Electron
- machine activation limit
- autoupdates
- mailgun emails
etc.
These things seemed super scary at first. I always thought it was way too much work and something would break. But I'm glad I persisted. So far the only problem I have is that mailgun is not delivering the license keys to certain domains like https://t.co/6Bqn0FUYXo etc. 👌
omg I just realized that me . com is an Apple domain, of course something wouldn't work with these dicks

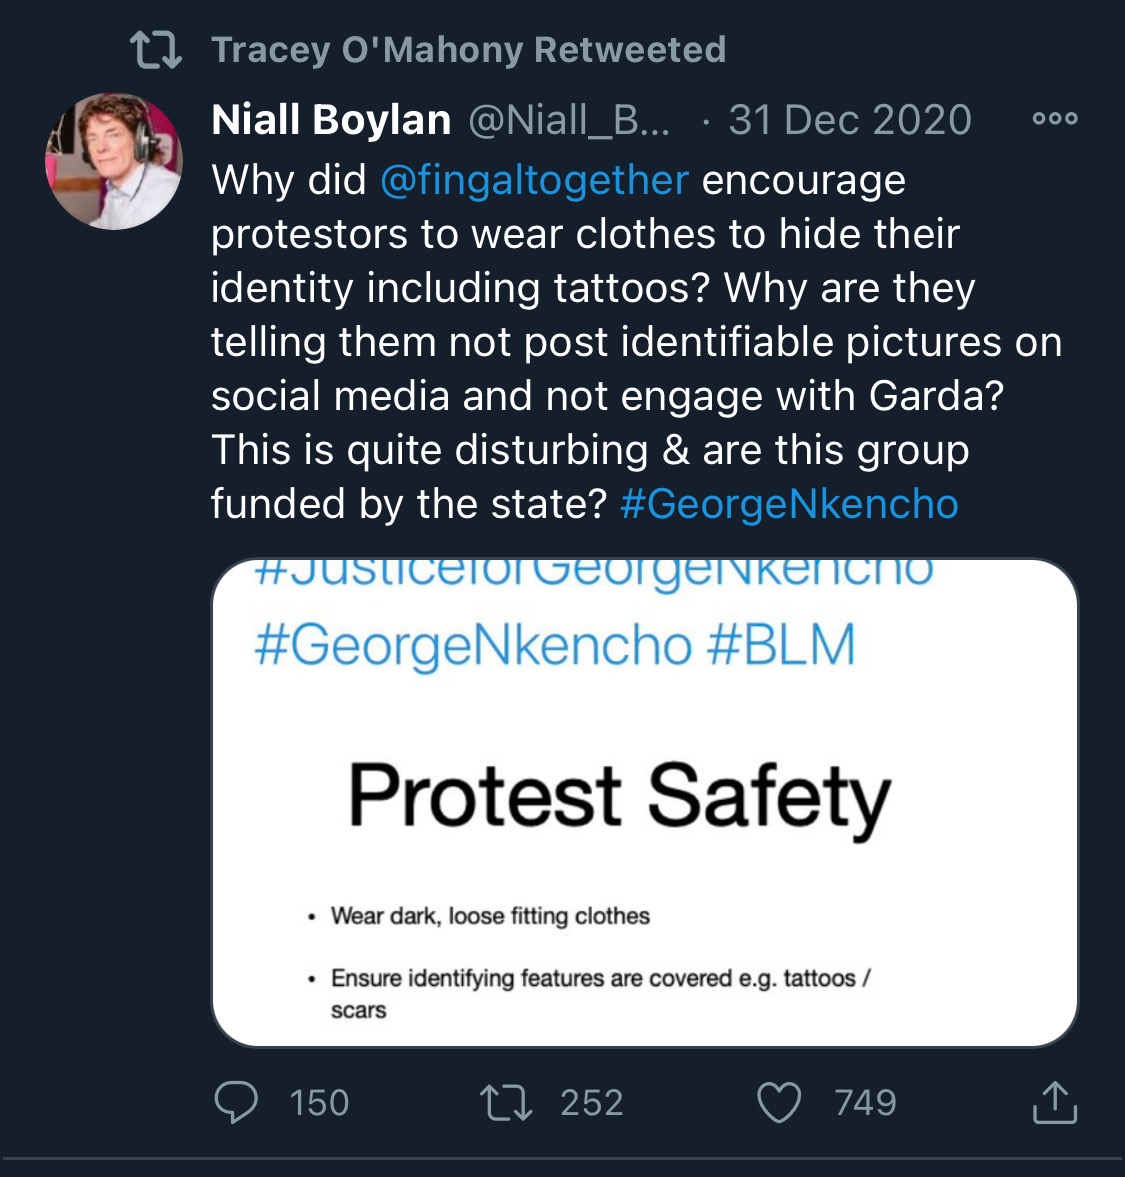
Fake chats claiming to be from the Irish African community are being disseminated by the far right in order to suggest that violence is imminent from #BLM supporters. This is straight out of the QAnon and Proud Boys playbook. Spread the word. Protest safely. #georgenkencho

There is co-ordination across the far right in Ireland now to stir both left and right in the hopes of creating a race war. Think critically! Fascists see the tragic killing of #georgenkencho, the grief of his community and pending investigation as a flashpoint for action.
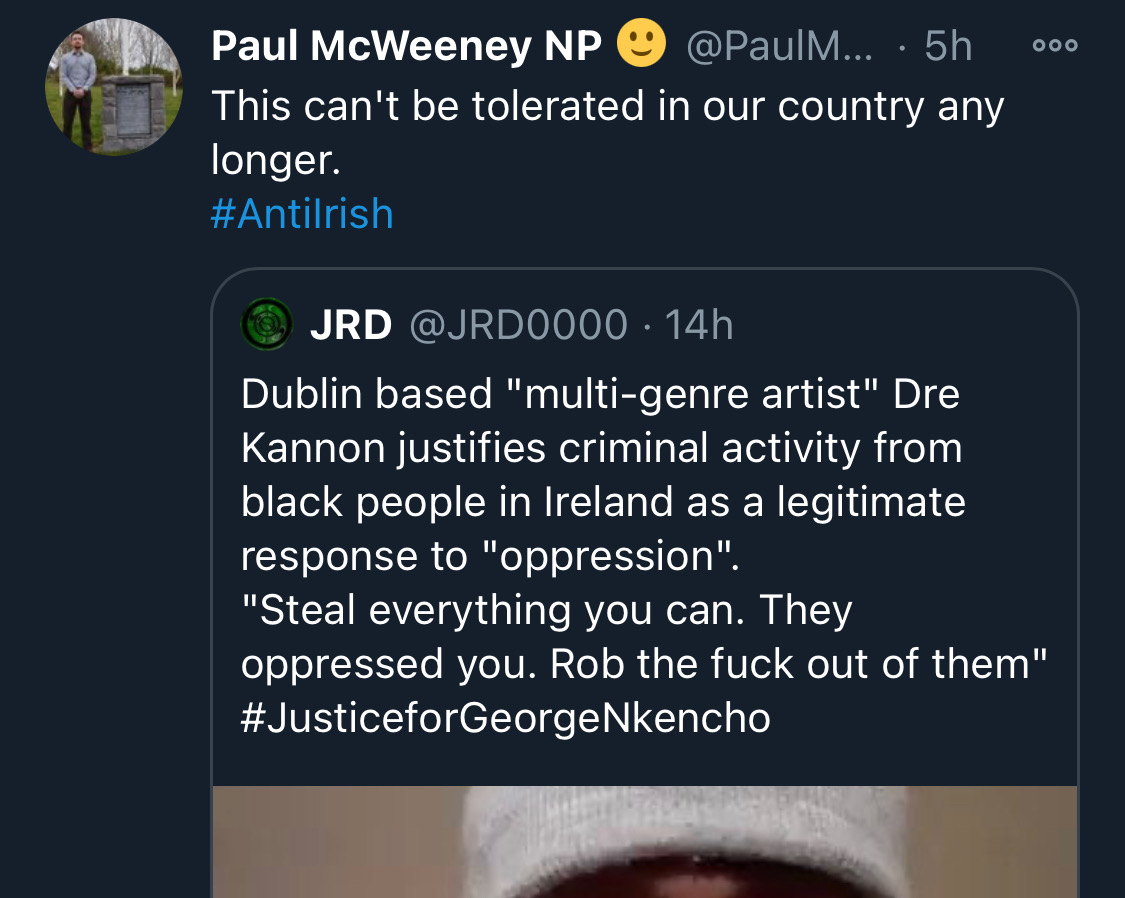
Across Telegram, Twitter and Facebook disinformation is being peddled on the back of these tragic events. From false photographs to the tactics ofwhite supremacy, the far right is clumsily trying to drive hate against minority groups and figureheads.
Declan Ganley’s Burkean group and the incel wing of National Party (Gearóid Murphy, Mick O’Keeffe & Co.) as well as all the usuals are concerted in their efforts to demonstrate their white supremacist cred. The quiet parts are today being said out loud.
The best thing you can do is challenge disinformation and report posts where engagement isn’t appropriate. Many of these are blatantly racist posts designed to drive recruitment to NP and other Nationalist groups. By all means protest but stay safe.
There is co-ordination across the far right in Ireland now to stir both left and right in the hopes of creating a race war. Think critically! Fascists see the tragic killing of #georgenkencho, the grief of his community and pending investigation as a flashpoint for action.
Across Telegram, Twitter and Facebook disinformation is being peddled on the back of these tragic events. From false photographs to the tactics ofwhite supremacy, the far right is clumsily trying to drive hate against minority groups and figureheads.
Be aware, the images the #farright are sharing in the hopes of starting a race war, are not of the SPAR employee that was punched. They\u2019re older photos of a Everton fan. Be aware of the information you\u2019re sharing and that it may be false. Always #factcheck #GeorgeNkencho pic.twitter.com/4c9w4CMk5h
— antifa.drone (@antifa_drone) December 31, 2020
Declan Ganley’s Burkean group and the incel wing of National Party (Gearóid Murphy, Mick O’Keeffe & Co.) as well as all the usuals are concerted in their efforts to demonstrate their white supremacist cred. The quiet parts are today being said out loud.
There is a concerted effort in far-right Telegram groups to try and incite violence on street by targetting people for racist online abuse following the killing of George Nkencho
— Mark Malone (@soundmigration) January 1, 2021
This follows on and is part of a misinformation campaign to polarise communities at this time.
The best thing you can do is challenge disinformation and report posts where engagement isn’t appropriate. Many of these are blatantly racist posts designed to drive recruitment to NP and other Nationalist groups. By all means protest but stay safe.