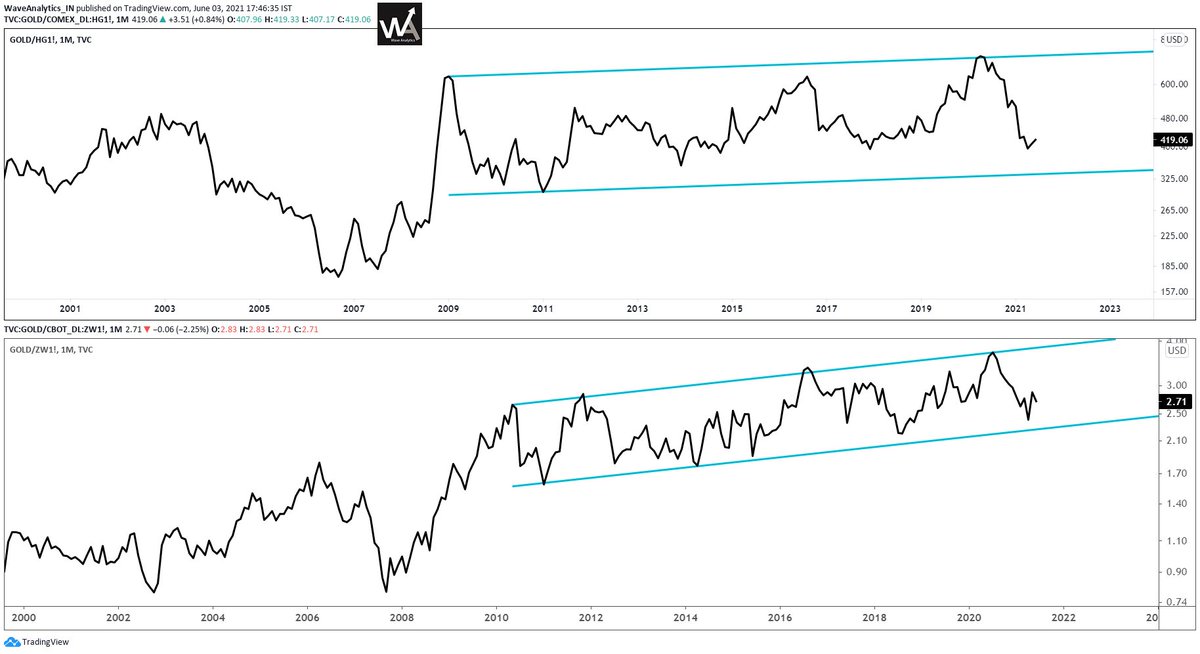
"Gold / Copper" and "Gold / Wheat" - Both reaching other end of the Band from where it would be more in favor of Gold.

More from Piyush Chaudhry
#APOLLOHOSP @ 2110 - Long Term Chart.
— Piyush Chaudhry (@piyushchaudhry) November 12, 2020
I see a fair possibility of the stock rising to 3500-5000 zone over next few years and an open possibility of the next zone of 5000-7500 as well.
Invalidation on break below Blue TL. pic.twitter.com/QJ5aY4eTT8
15 Months to this post. No change in the larger projections.
Long Term Chart of the Year.#NIFTY - Wave 5 (Cycle Degree) Target Zone of 25000-34000 by 2024-2027.
— Piyush Chaudhry (@piyushchaudhry) December 19, 2020
Reassessment on a breach below Blue Trendline. A breach is not a necessary invalidation. Depends on internals.
The dashed path is for representative purpose only. #ElliottWave pic.twitter.com/1xVY4OSr5T
More from Gold
This might be the best gold analog chart i have ever seen. When you overlap the yellow 1970-1980 inflationary gold bull market over the green 1999-2021 #gold bull the correlation is unbelievable. Chart from Mike Maloney. Protect your fiat holdings from oncoming inflation. $GLD pic.twitter.com/R9Hyl9Nwe3
— Edward Gofsky (@EdwardGofsky) May 10, 2021