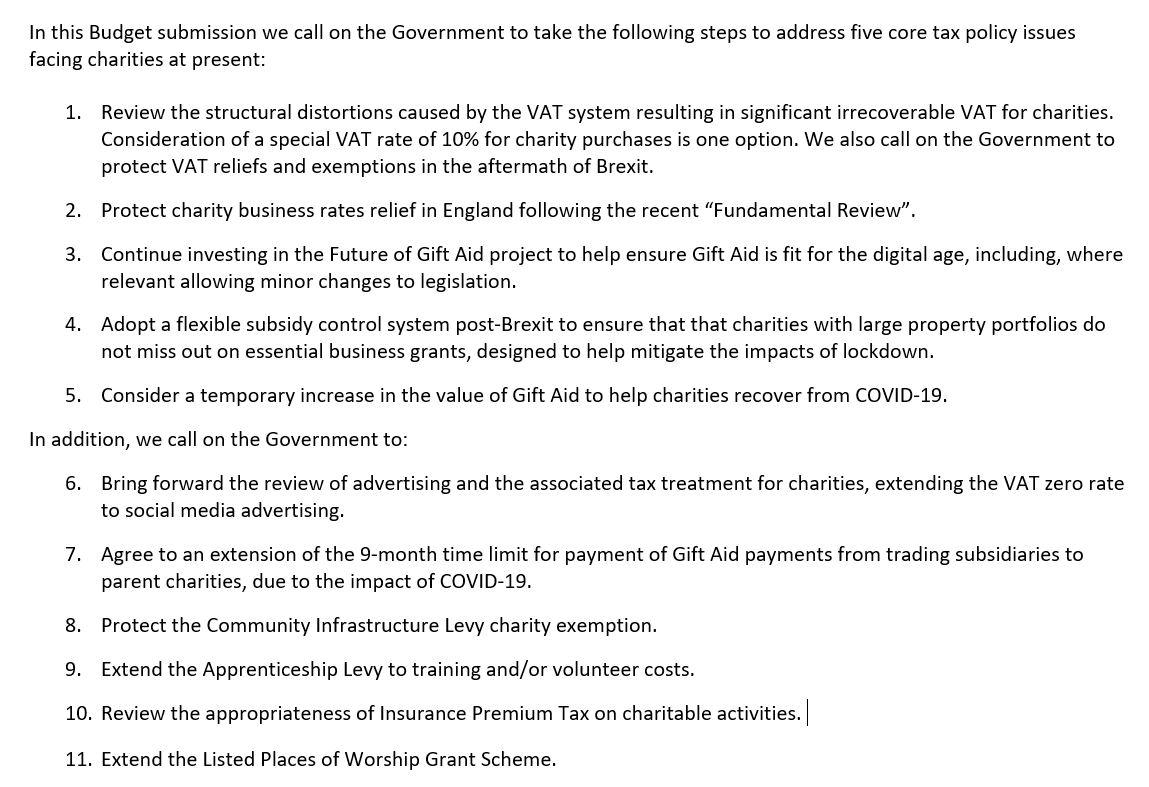
The Charity Tax Group and @CFGtweets have submitted Budget representations to @hmtreasury calling for an improved tax system for #charities in the aftermath of Brexit and COVID #charitytax 1/ https://t.co/mCiCpSQj2g

More from Finance
Thread: P&F Super Pattern
An effective price pattern defined using properties of P&F charts.
#Superpattern #Pointandfigure #Definedge
Point & Figure is an oldest charting method where price is plotted vertically, and the chart moves only when price moves. It is a different way of looking at the price, the objective box-value and reversal value offers advantage of identifying objective price patterns.
When price is moving up, it is plotted in a column of 'X'. When it is going down, it is plotted in a column of ‘O’. Normally, three-box reversal criteria is used to define the trend & reversal. Unlike a bar or candle, the P&F column can have multiple sessions in it.
Link to know more about the subject:
https://t.co/2xtLAVPBvm
See below chart. Price is in a strong uptrend, P&F chart would produce a long of column of 'X' with more number of boxes in it.
If such a trend is followed by some time bars without meaningful price correct, P&F chart would not move, and it will remain in column of 'X' in such a scenario.
An effective price pattern defined using properties of P&F charts.
#Superpattern #Pointandfigure #Definedge

Point & Figure is an oldest charting method where price is plotted vertically, and the chart moves only when price moves. It is a different way of looking at the price, the objective box-value and reversal value offers advantage of identifying objective price patterns.
When price is moving up, it is plotted in a column of 'X'. When it is going down, it is plotted in a column of ‘O’. Normally, three-box reversal criteria is used to define the trend & reversal. Unlike a bar or candle, the P&F column can have multiple sessions in it.

Link to know more about the subject:
https://t.co/2xtLAVPBvm
See below chart. Price is in a strong uptrend, P&F chart would produce a long of column of 'X' with more number of boxes in it.

If such a trend is followed by some time bars without meaningful price correct, P&F chart would not move, and it will remain in column of 'X' in such a scenario.

Ivor Cummins has been wrong (or lying) almost entirely throughout this pandemic and got paid handsomly for it.
He has been wrong (or lying) so often that it will be nearly impossible for me to track every grift, lie, deceit, manipulation he has pulled. I will use...
... other sources who have been trying to shine on light on this grifter (as I have tried to do, time and again:
Example #1: "Still not seeing Sweden signal versus Denmark really"... There it was (Images attached).
19 to 80 is an over 300% difference.
Tweet: https://t.co/36FnYnsRT9
Example #2 - "Yes, I'm comparing the Noridcs / No, you cannot compare the Nordics."
I wonder why...
Tweets: https://t.co/XLfoX4rpck / https://t.co/vjE1ctLU5x
Example #3 - "I'm only looking at what makes the data fit in my favour" a.k.a moving the goalposts.
Tweets: https://t.co/vcDpTu3qyj / https://t.co/CA3N6hC2Lq
He has been wrong (or lying) so often that it will be nearly impossible for me to track every grift, lie, deceit, manipulation he has pulled. I will use...

... other sources who have been trying to shine on light on this grifter (as I have tried to do, time and again:
Ivor Cummins BE (Chem) is a former R&D Manager at HP (sourcre: https://t.co/Wbf5scf7gn), turned Content Creator/Podcast Host/YouTube personality. (Call it what you will.)
— Steve (@braidedmanga) November 17, 2020
Example #1: "Still not seeing Sweden signal versus Denmark really"... There it was (Images attached).
19 to 80 is an over 300% difference.
Tweet: https://t.co/36FnYnsRT9

Example #2 - "Yes, I'm comparing the Noridcs / No, you cannot compare the Nordics."
I wonder why...
Tweets: https://t.co/XLfoX4rpck / https://t.co/vjE1ctLU5x

Example #3 - "I'm only looking at what makes the data fit in my favour" a.k.a moving the goalposts.
Tweets: https://t.co/vcDpTu3qyj / https://t.co/CA3N6hC2Lq

You May Also Like
So friends here is the thread on the recommended pathway for new entrants in the stock market.
Here I will share what I believe are essentials for anybody who is interested in stock markets and the resources to learn them, its from my experience and by no means exhaustive..
First the very basic : The Dow theory, Everybody must have basic understanding of it and must learn to observe High Highs, Higher Lows, Lower Highs and Lowers lows on charts and their
Even those who are more inclined towards fundamental side can also benefit from Dow theory, as it can hint start & end of Bull/Bear runs thereby indication entry and exits.
Next basic is Wyckoff's Theory. It tells how accumulation and distribution happens with regularity and how the market actually
Dow theory is old but
Here I will share what I believe are essentials for anybody who is interested in stock markets and the resources to learn them, its from my experience and by no means exhaustive..
First the very basic : The Dow theory, Everybody must have basic understanding of it and must learn to observe High Highs, Higher Lows, Lower Highs and Lowers lows on charts and their
Even those who are more inclined towards fundamental side can also benefit from Dow theory, as it can hint start & end of Bull/Bear runs thereby indication entry and exits.

Next basic is Wyckoff's Theory. It tells how accumulation and distribution happens with regularity and how the market actually
Dow theory is old but
Old is Gold....
— Professor (@DillikiBiili) January 23, 2020
this Bharti Airtel chart is a true copy of the Wyckoff Pattern propounded in 1931....... pic.twitter.com/tQ1PNebq7d