
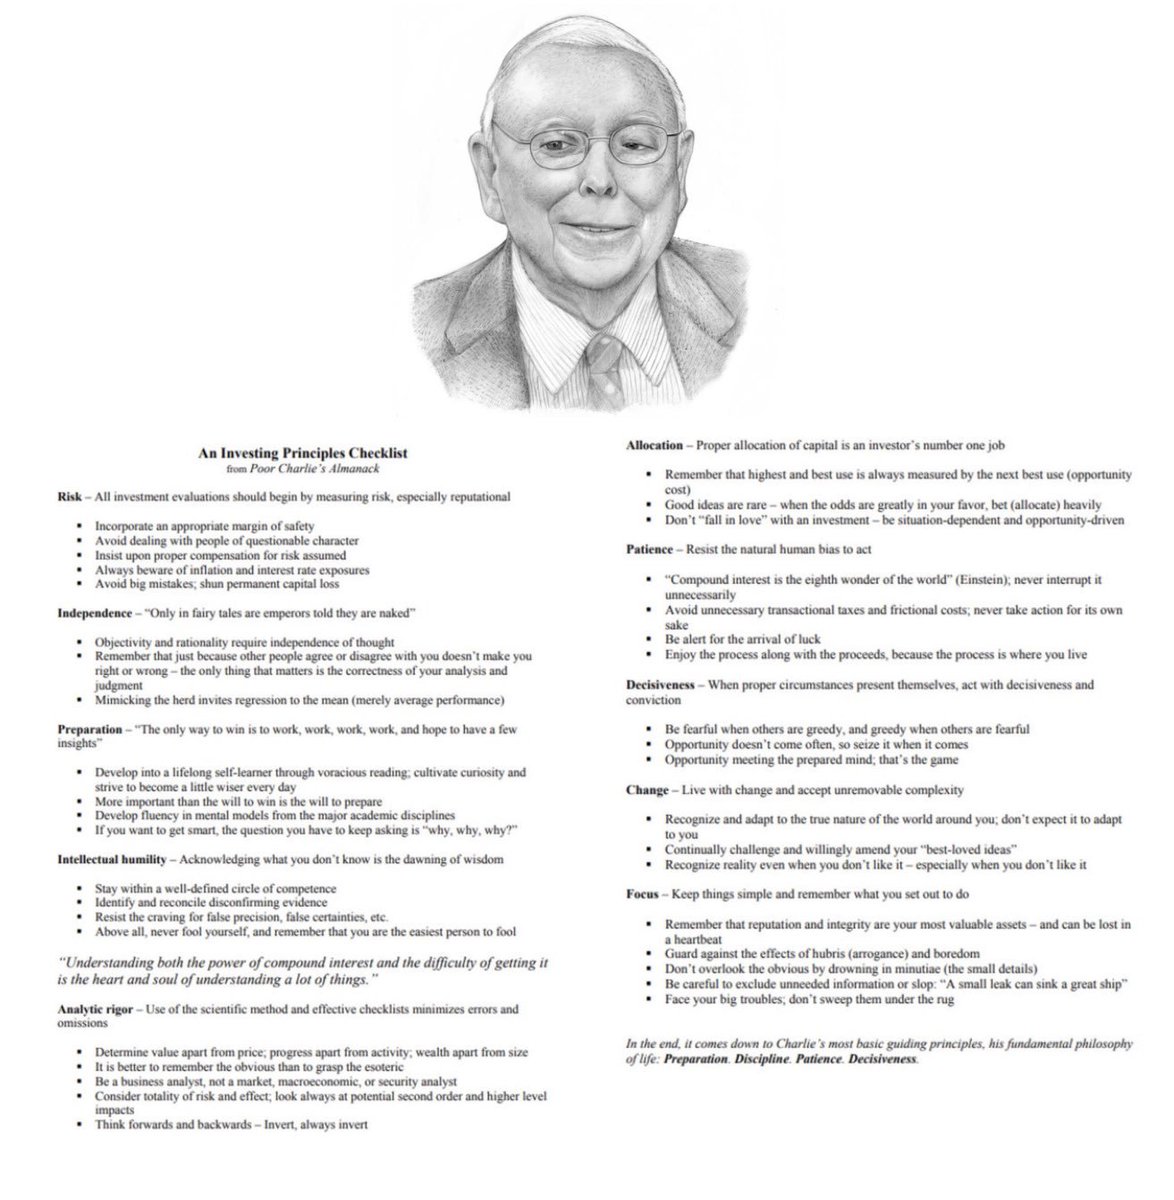
10 Key Takeaways from the book: The Emotionally Intelligent Investor


More from Investment Books (Dhaval)



More from Finance


1/ I'm thrilled to announce the launch of my new website, a one-stop shop for all the content I'm creating.
There you'll find links to all my podcasts, the TTMYGH newsletter, and other exciting future projects.
2/ In 2020, I reignited my passion for interviewing brilliant people by launching The Grant Williams Podcast in various forms, including The End Game, The Super Terrific Happy Hour, and The Narrative Game.
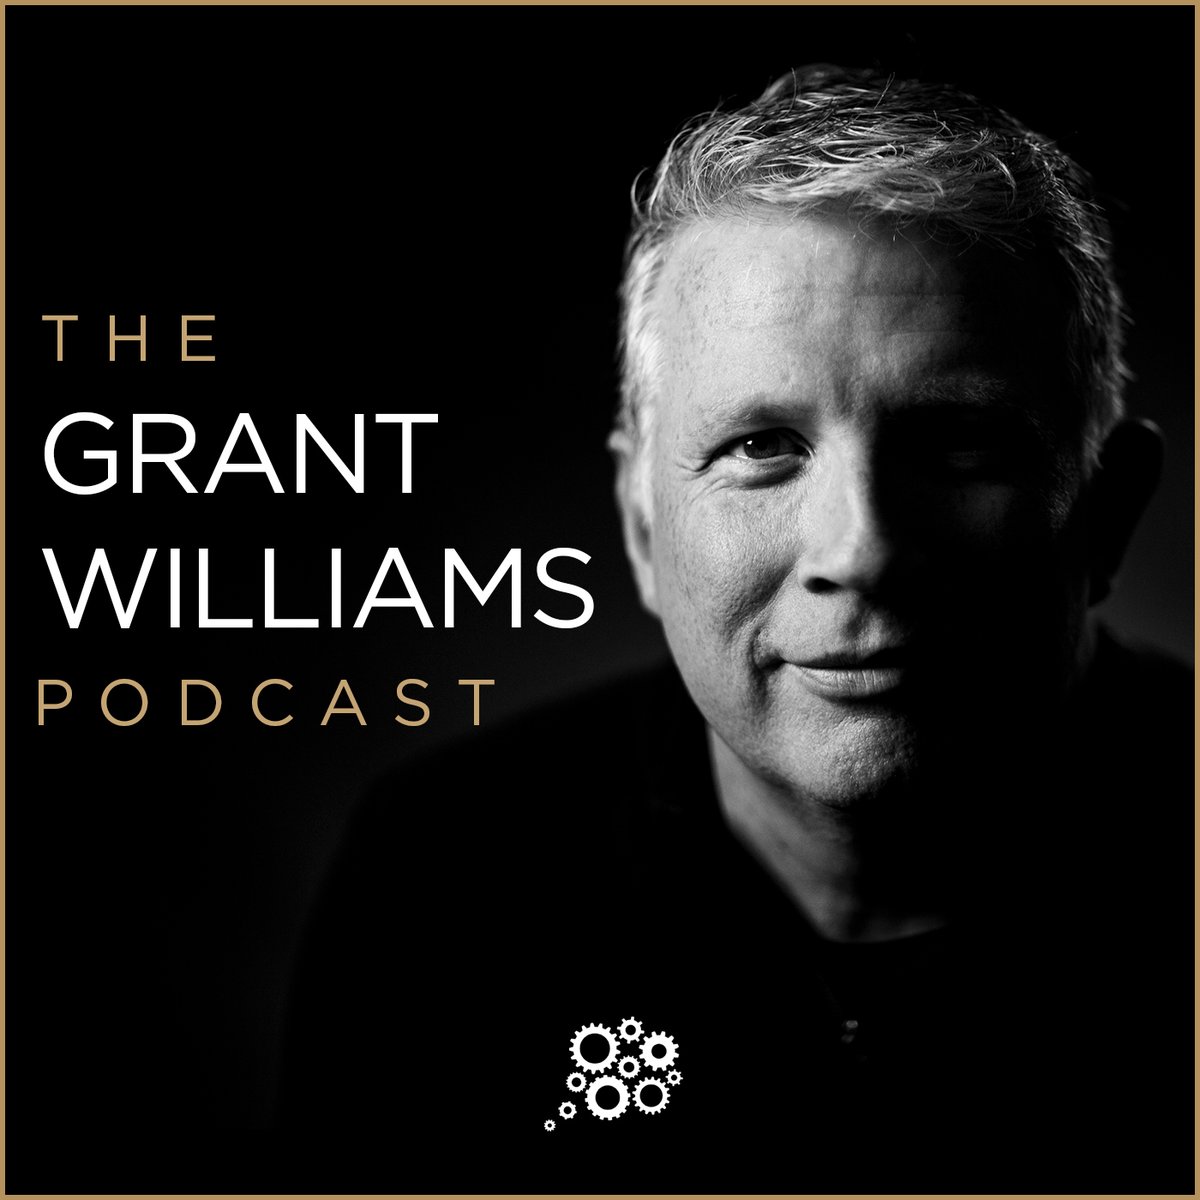
3/ Starting February 1, I'm taking the bold step of moving these podcasts completely behind a paywall.
For the very affordable price of only $10 a month, listeners can gain access to the Copper Tier of https://t.co/fxUfH8maI4, which includes all current & future podcasts.
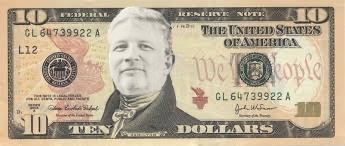
4/ Why am I doing this? First and foremost, I aspire to create VALUABLE content. By definition, if something is priced at $0, it isn’t valuable. The time, effort and creativity that goes into these episodes is substantial. To keep doing them properly, they can no longer be free.
5/ I also strongly believe content creators should be able to make a living creating content. If everything is free, that’s not possible. I never seriously considered accepting outside sponsors – complete integrity is too critical to me.
There you'll find links to all my podcasts, the TTMYGH newsletter, and other exciting future projects.
2/ In 2020, I reignited my passion for interviewing brilliant people by launching The Grant Williams Podcast in various forms, including The End Game, The Super Terrific Happy Hour, and The Narrative Game.
3/ Starting February 1, I'm taking the bold step of moving these podcasts completely behind a paywall.
For the very affordable price of only $10 a month, listeners can gain access to the Copper Tier of https://t.co/fxUfH8maI4, which includes all current & future podcasts.
4/ Why am I doing this? First and foremost, I aspire to create VALUABLE content. By definition, if something is priced at $0, it isn’t valuable. The time, effort and creativity that goes into these episodes is substantial. To keep doing them properly, they can no longer be free.
5/ I also strongly believe content creators should be able to make a living creating content. If everything is free, that’s not possible. I never seriously considered accepting outside sponsors – complete integrity is too critical to me.



Rule 4 : If buying a naked option, always ensure that implied volatility is low. This can be understood from the level of IV vis a vis historical IV levels. Use IVR or IVP etc.
For a naked option to make money, it's better if IV rises or at least stays flat.
This is a thread I wrote on IV, IVR etc
For a naked option to make money, it's better if IV rises or at least stays flat.
Rule 3 : DO NOT run or trade everything that moves. Focus on a few stocks and master them. When a move comes, make the max out of that move.
— Subhadip Nandy (@SubhadipNandy16) October 14, 2021
Example : in this crazy mkt, I did not even trade TataMotors this week. Stayed focussed on ITC and it gave good returns https://t.co/41wkugZg1I
This is a thread I wrote on IV, IVR etc
IV - A thread
— Subhadip Nandy (@SubhadipNandy16) September 20, 2018
In financial mathematics, implied volatility of an option contract is
that value of the volatility of the underlying instrument which, when
input in an option pricing model ) will return a theoretical value equal to the current market price of the option (1/n)
You May Also Like


I’m torn on how to approach the idea of luck. I’m the first to admit that I am one of the luckiest people on the planet. To be born into a prosperous American family in 1960 with smart parents is to start life on third base. The odds against my very existence are astronomical.
I’ve always felt that the luckiest people I know had a talent for recognizing circumstances, not of their own making, that were conducive to a favorable outcome and their ability to quickly take advantage of them.
In other words, dumb luck was just that, it required no awareness on the person’s part, whereas “smart” luck involved awareness followed by action before the circumstances changed.
So, was I “lucky” to be born when I was—nothing I had any control over—and that I came of age just as huge databases and computers were advancing to the point where I could use those tools to write “What Works on Wall Street?” Absolutely.
Was I lucky to start my stock market investments near the peak of interest rates which allowed me to spend the majority of my adult life in a falling rate environment? Yup.
Ironies of Luck https://t.co/5BPWGbAxFi
— Morgan Housel (@morganhousel) March 14, 2018
"Luck is the flip side of risk. They are mirrored cousins, driven by the same thing: You are one person in a 7 billion player game, and the accidental impact of other people\u2019s actions can be more consequential than your own."
I’ve always felt that the luckiest people I know had a talent for recognizing circumstances, not of their own making, that were conducive to a favorable outcome and their ability to quickly take advantage of them.
In other words, dumb luck was just that, it required no awareness on the person’s part, whereas “smart” luck involved awareness followed by action before the circumstances changed.
So, was I “lucky” to be born when I was—nothing I had any control over—and that I came of age just as huge databases and computers were advancing to the point where I could use those tools to write “What Works on Wall Street?” Absolutely.
Was I lucky to start my stock market investments near the peak of interest rates which allowed me to spend the majority of my adult life in a falling rate environment? Yup.


