$NOVN DD Thread (1)
Title: A fundamental analysis covering the most important and valuable information about the recently published 10-Q report of Novan Inc. An in-depth discussion on certain formulations and developments in the area of equity financing and investor interest.

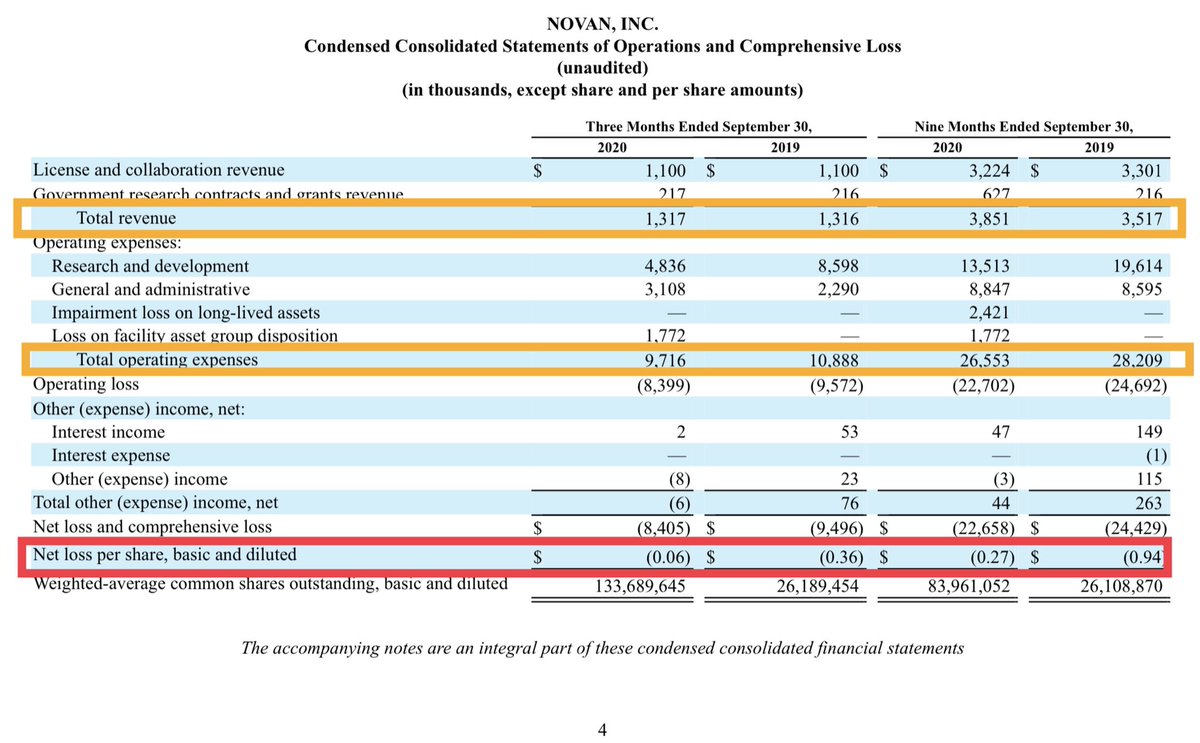
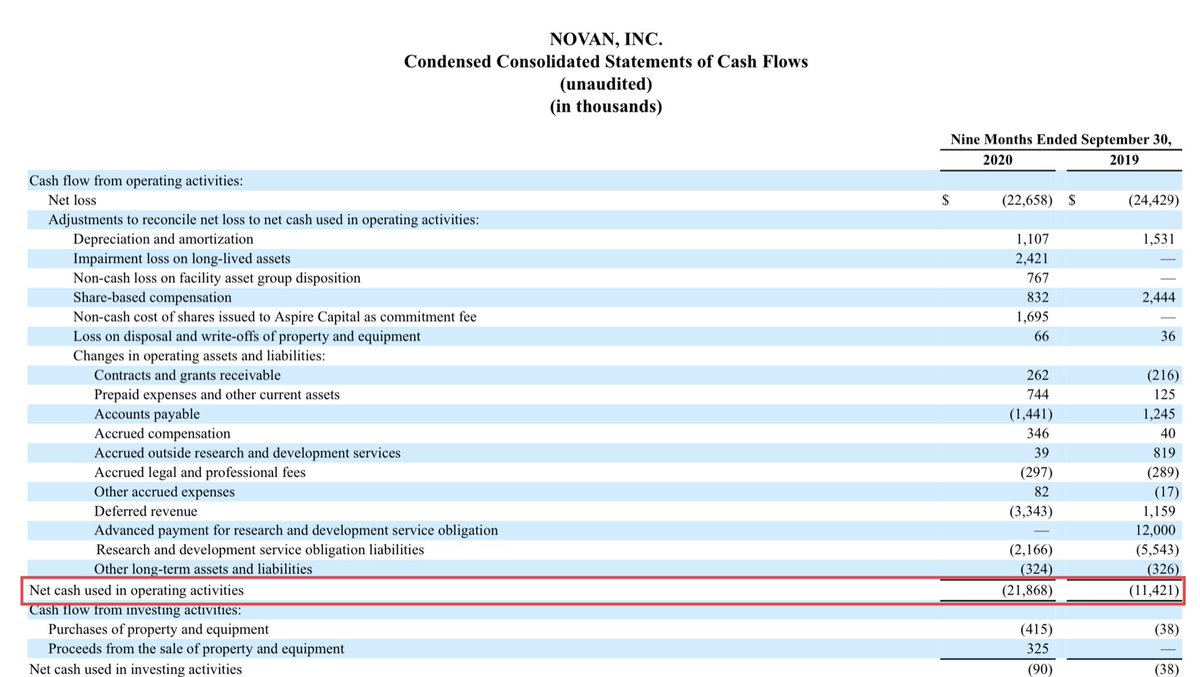
Let‘s start with a look at some numbers on the balance sheet: Total current assets have been increased significantly compared to December 31, 2019. With cash and cash equivalents in the amount of $43,072M we can see that $NOVN...
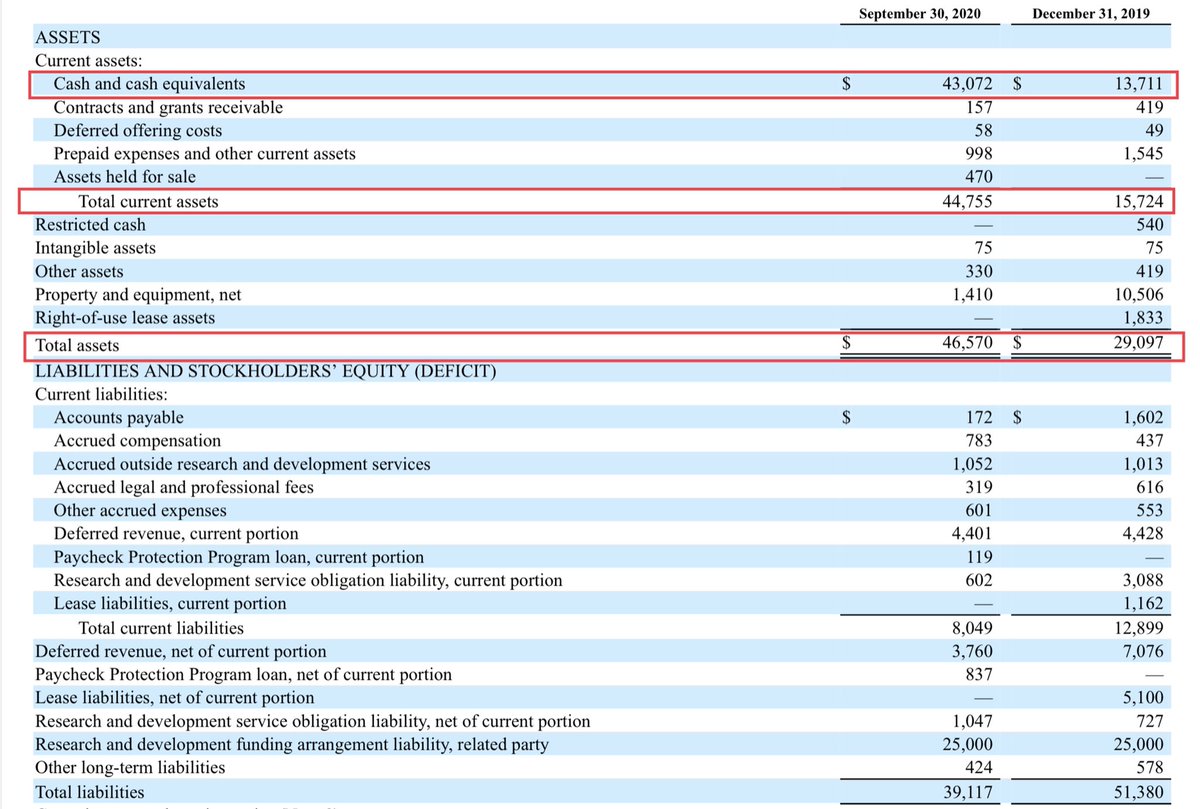
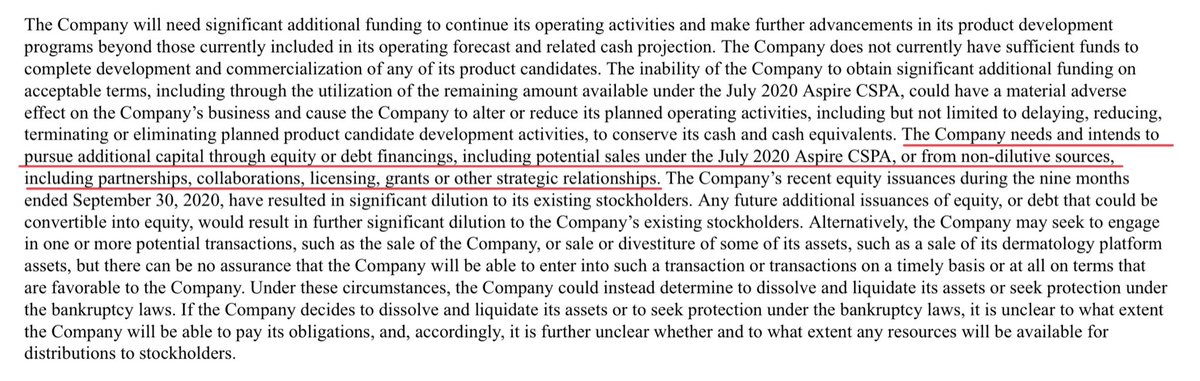
In its consolidated financial statements, $NOVN clarifies how this initial financial situation will affect future operating business.


(The following is only an abridged version of financial transactions that were included in the company’s financing activities during the course of the year.) $NOVN

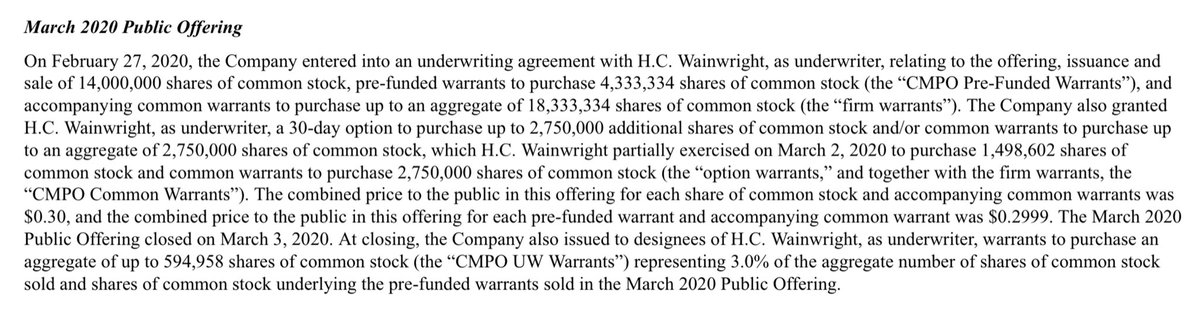
March 2020 Public Offering:
- Underwriter: H.C. Wainwright
- Issuance and sale of 14M shares, pre-funded warrants to purchase 4,333,334 shares (Note: CMPO-Pre-Funded-Warrants) and common warrants to purchase 18,333,334 shares (firm warrants)...

- Combined price to the public (each share of common stock and accompanying common warrants): $0.30 / Combined price to the public (each pre-funded warrant and accompanying common warrant): $0.2999.
- Public Offering closed on March 3, 2020. $NOVN

- Exercise price for CMPO Pre-Funded Warrants = $0.0001 per share.
- Exercise price for CMPO Common Warrants = $0.30 per share.
- Exercise price...

- Net proceeds from the offering and from the exercise of CMPO Common Warrants: $5,158M and $5,538M.
Most important aspect of this summary is the amount of exercised warrants throughout this year. We‘ll talk about this later. $NOVN
- Underwriters: Several institutional and accredited investors.
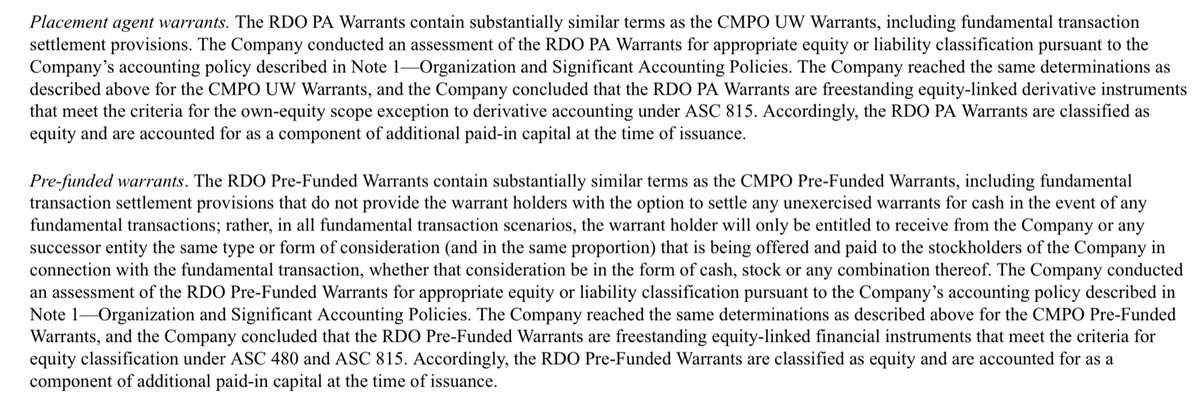
- Issuance and sale of 10,55M shares and pre-funded warrants to purchase 8,054,652 shares (the RDO-Pre-Funded-Warrants).
- Purchase price for each share = $0.43

- Offering closed on March 26, 2020.
- $NOVN also issued to the designees of HC Wainwright, as placement agent, warrants to purchase 558,140 shares (the RDO-PA-Warrants).
- Net proceeds from the offering = $7,225M.
- Exercise price for the RDO PA Warrants = $0.5375 per share.
Again, all RDO Pre-Funded Warrants have been completely exercised. $NOVN
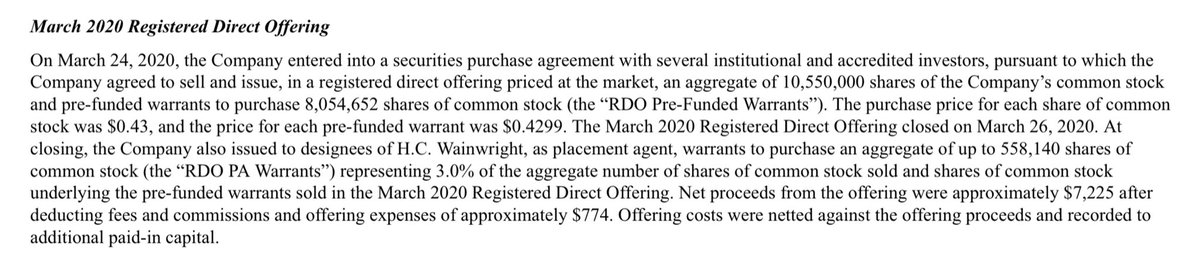
- Joseph Moglia participated in the March 2020 Regist. Direct Offering and purchased 1M shares for $430,000. He‘s a greater than 5% Owner.


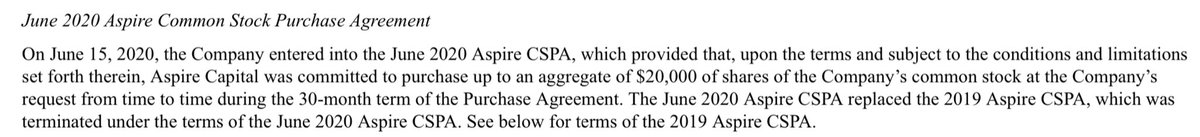
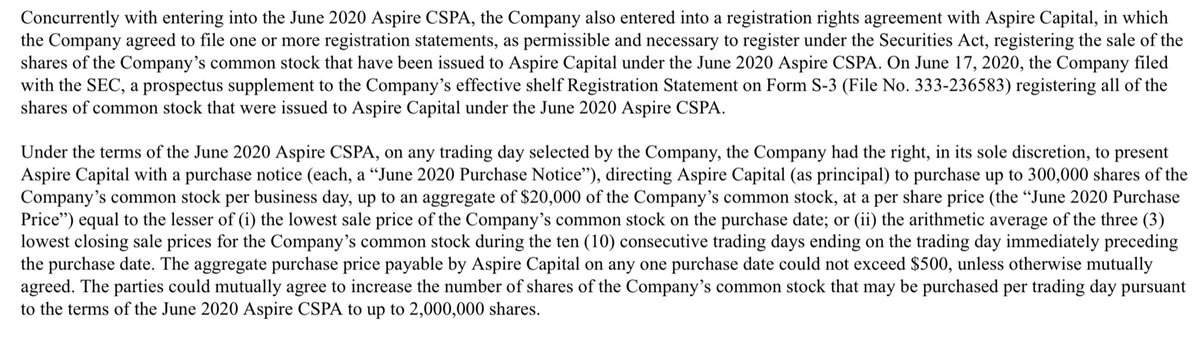
- June 2020 Aspire CF PA: $20M worth of shares. Primary conditions: purchasing stock at the company’s request,...
- $NOVN issued to...


More from Finance


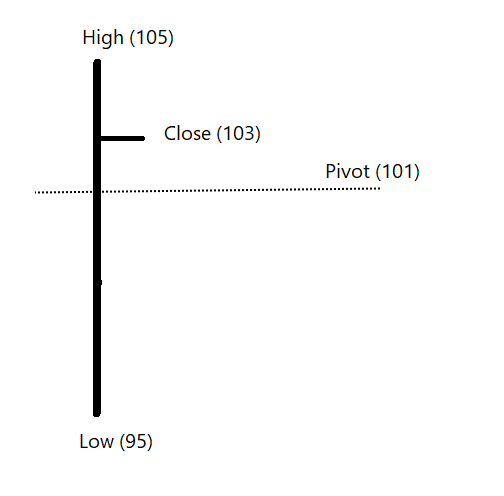


Two year back thread on MFI, someone liked this so came up in notifications . Rather than running around 100s of indicators, I have made this my go to indicator under any circumstances and have been using this for years
This thread actually had some great answers , one can learn a lot about the thought processes of different traders from the answers. Please go thru them
What do you think/use as the most robust leading indicator if following technical analysis ? Please answer with reason , I will provide my answer after 2 hours
— Subhadip Nandy (@SubhadipNandy16) August 12, 2019
( At Delhi airport , bored as hell )
This thread actually had some great answers , one can learn a lot about the thought processes of different traders from the answers. Please go thru them
You May Also Like


https://t.co/6cRR2B3jBE
Viruses and other pathogens are often studied as stand-alone entities, despite that, in nature, they mostly live in multispecies associations called biofilms—both externally and within the host.
https://t.co/FBfXhUrH5d

Microorganisms in biofilms are enclosed by an extracellular matrix that confers protection and improves survival. Previous studies have shown that viruses can secondarily colonize preexisting biofilms, and viral biofilms have also been described.

...we raise the perspective that CoVs can persistently infect bats due to their association with biofilm structures. This phenomenon potentially provides an optimal environment for nonpathogenic & well-adapted viruses to interact with the host, as well as for viral recombination.

Biofilms can also enhance virion viability in extracellular environments, such as on fomites and in aquatic sediments, allowing viral persistence and dissemination.

Viruses and other pathogens are often studied as stand-alone entities, despite that, in nature, they mostly live in multispecies associations called biofilms—both externally and within the host.
https://t.co/FBfXhUrH5d
Microorganisms in biofilms are enclosed by an extracellular matrix that confers protection and improves survival. Previous studies have shown that viruses can secondarily colonize preexisting biofilms, and viral biofilms have also been described.
...we raise the perspective that CoVs can persistently infect bats due to their association with biofilm structures. This phenomenon potentially provides an optimal environment for nonpathogenic & well-adapted viruses to interact with the host, as well as for viral recombination.
Biofilms can also enhance virion viability in extracellular environments, such as on fomites and in aquatic sediments, allowing viral persistence and dissemination.