🩸FIBONACCI retracement and GOLDEN RATIO - PART 2
Before we move forward, kindly like and retweet if you find our content is adding something to your knowledge.

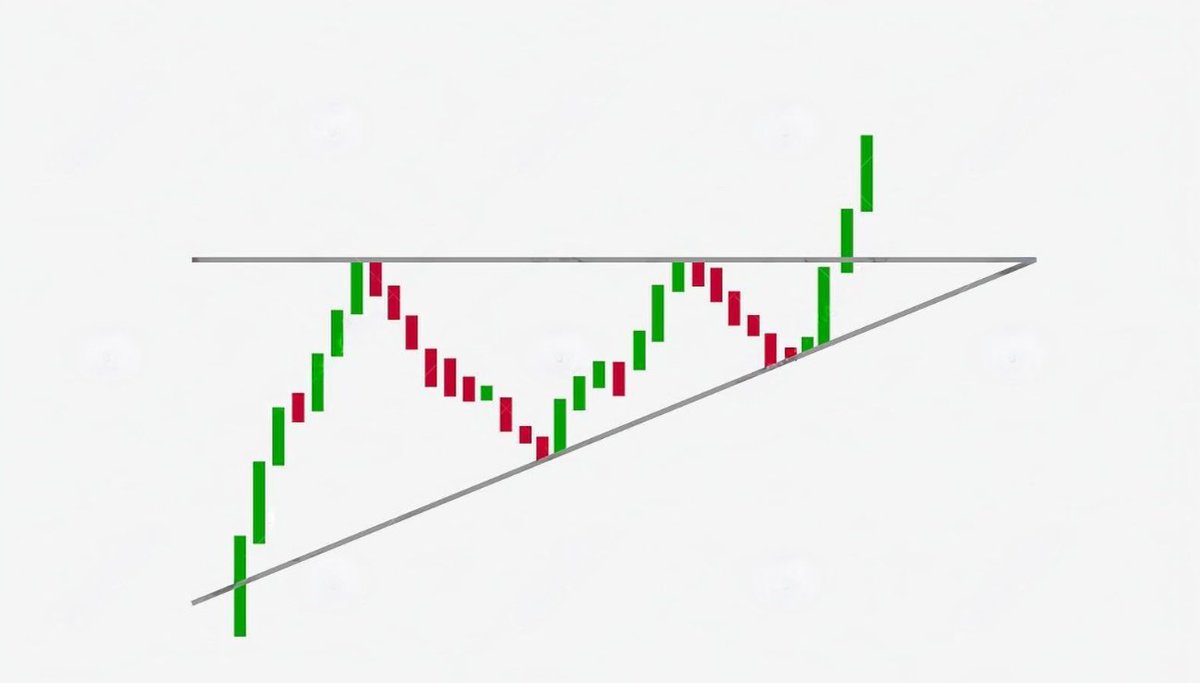
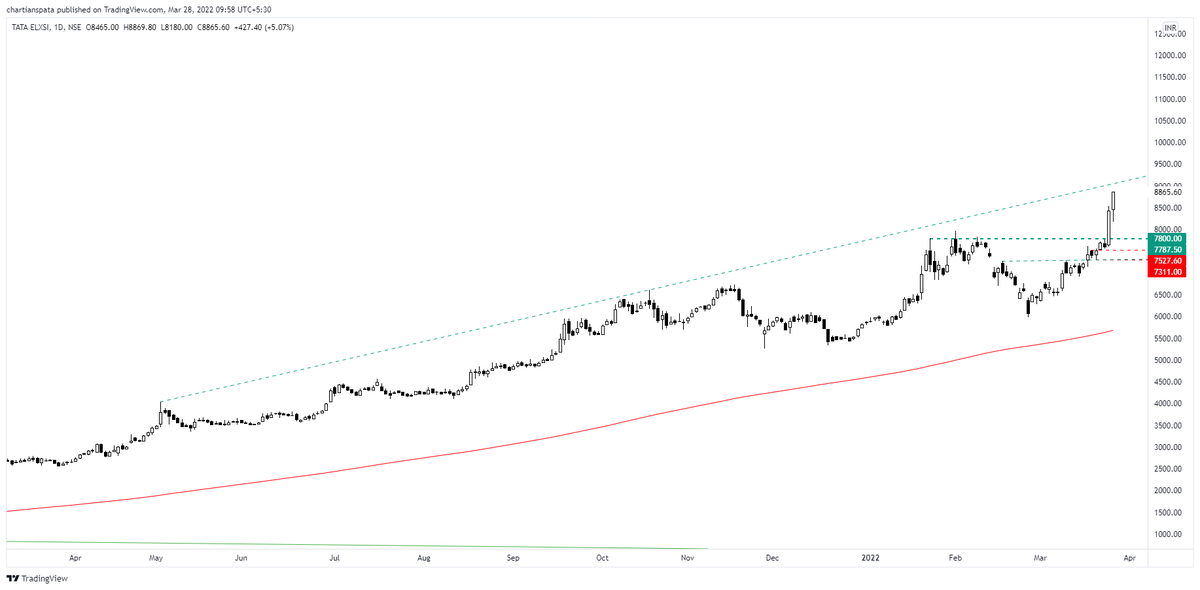
Drawing Fibonacci retracemnts are fairly simple. The main point we look into is, If the direction of retracment is up or down side.
✅ If the trend is up, choose lower point and a higher point. Connect lower point with higher point using Fibo tool.
✅Take lower point as point from where the trend has started, which means one should not take points where consolidation was going on.
The choice of points is debatable. There is no fixed method. But above mentioned technique works and has a fair probability of success.
✅0.618
✅0.5
In an up trending stock, If stock starts consolidating and reversing from 0.618 of retracement, we term it as bullish sign and trend is going to be continued towards new high.
🎯Time frame can be daily and weekly charts


LIKE and RETWEET if you found the knowledge is worth sharing.
More from The Chartians

Took me 5 years to get the best Chartink scanners for Stock Market, but you’ll get it in 5 mminutes here ⏰
Do Share the above tweet 👆
These are going to be very simple yet effective pure price action based scanners, no fancy indicators nothing - hope you liked it.
https://t.co/JU0MJIbpRV
52 Week High
One of the classic scanners very you will get strong stocks to Bet on.
https://t.co/V69th0jwBr
Hourly Breakout
This scanner will give you short term bet breakouts like hourly or 2Hr breakout
Volume shocker
Volume spurt in a stock with massive X times
More from Fibonacci


1.
Start fibo retracement from swing high, not the other way around. Simply 0 point should b where retracement started
2.
The base should b chosen as major swing low. Can't just pick a random point
Start fibo retracement from swing high, not the other way around. Simply 0 point should b where retracement started
2.
The base should b chosen as major swing low. Can't just pick a random point
Similar views (shared Yesterday) Aneesh Bhai\U0001f447https://t.co/UxJZFdWJxh
— Bharat Sahni (@NiveshakBharat) September 29, 2021