
#Divislab - #daily
- Bullish hammer over trendline support & 21 EMA
- Looking for trend continuation with all time high of 5400 & 5600
- cmp - 5122.80, sl 5060 clbs.
@CAPratik_INDIAN @Investor_Mohit @RajarshitaS @sanstocktrader
#investing

More from Sachin Jain🇮🇳🌳


🧵 STOP wasting time searching for stocks.
Unlock the stock screener that makes it easy:
Check out the stocks that have broken through their 52-week highs on https://t.co/qBvDaqyp9R. They are some of the strongest in the market, so be sure to consider technicalities when trading them.
You've definitely heard of Darvas. Here's your chance to put his strategy into action: https://t.co/bk82BA8MMF

Intraday lovers: https://t.co/7Y866T9bRt

Do you know that narrow range breakout gives a punching returns in short span- https://t.co/vYfluY3TEH

Unlock the stock screener that makes it easy:
Check out the stocks that have broken through their 52-week highs on https://t.co/qBvDaqyp9R. They are some of the strongest in the market, so be sure to consider technicalities when trading them.
You've definitely heard of Darvas. Here's your chance to put his strategy into action: https://t.co/bk82BA8MMF
Intraday lovers: https://t.co/7Y866T9bRt
Do you know that narrow range breakout gives a punching returns in short span- https://t.co/vYfluY3TEH

More from Divis

DIVISLAB
Double Top Buy, T20 Pattern - Bullish, Super Pattern - Bullish above 4394.59 daily close on 1% Box Size chart. https://t.co/3F3aLZk5td
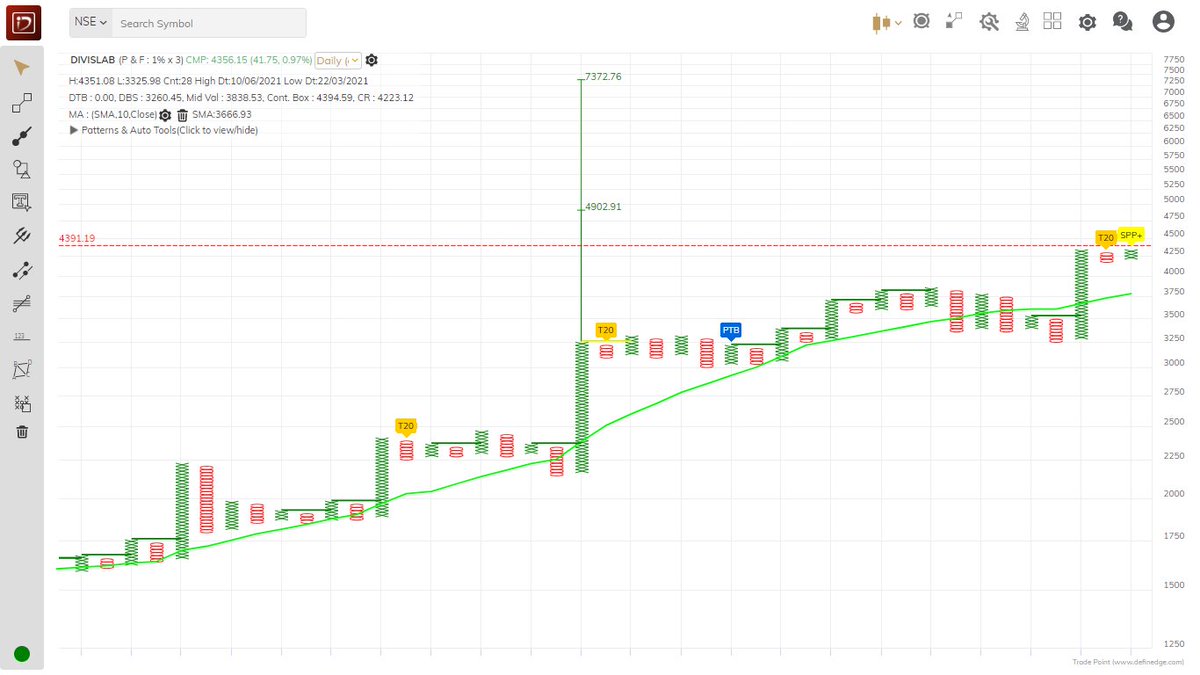
Double Top Buy, T20 Pattern - Bullish, Super Pattern - Bullish above 4394.59 daily close on 1% Box Size chart. https://t.co/3F3aLZk5td
DIVISLAB
— Saket Reddy (@saketreddy) June 28, 2020
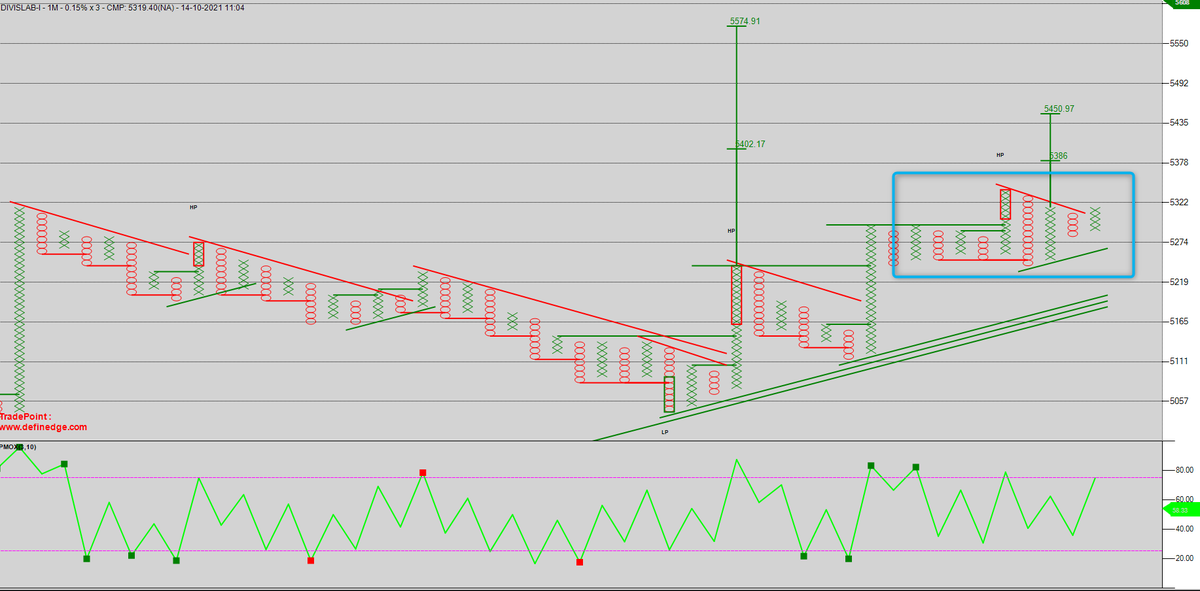
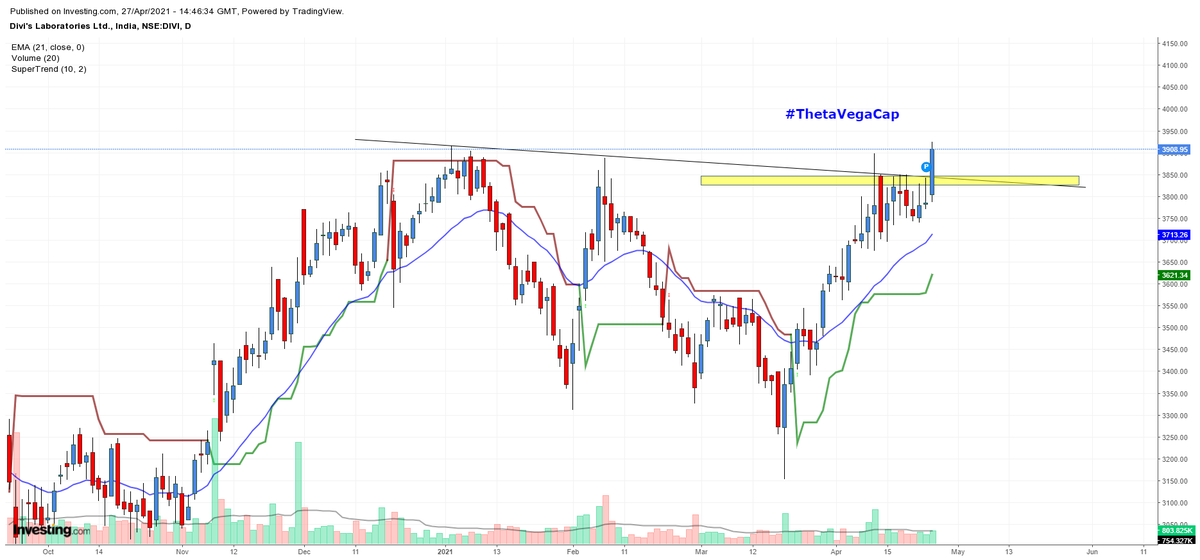
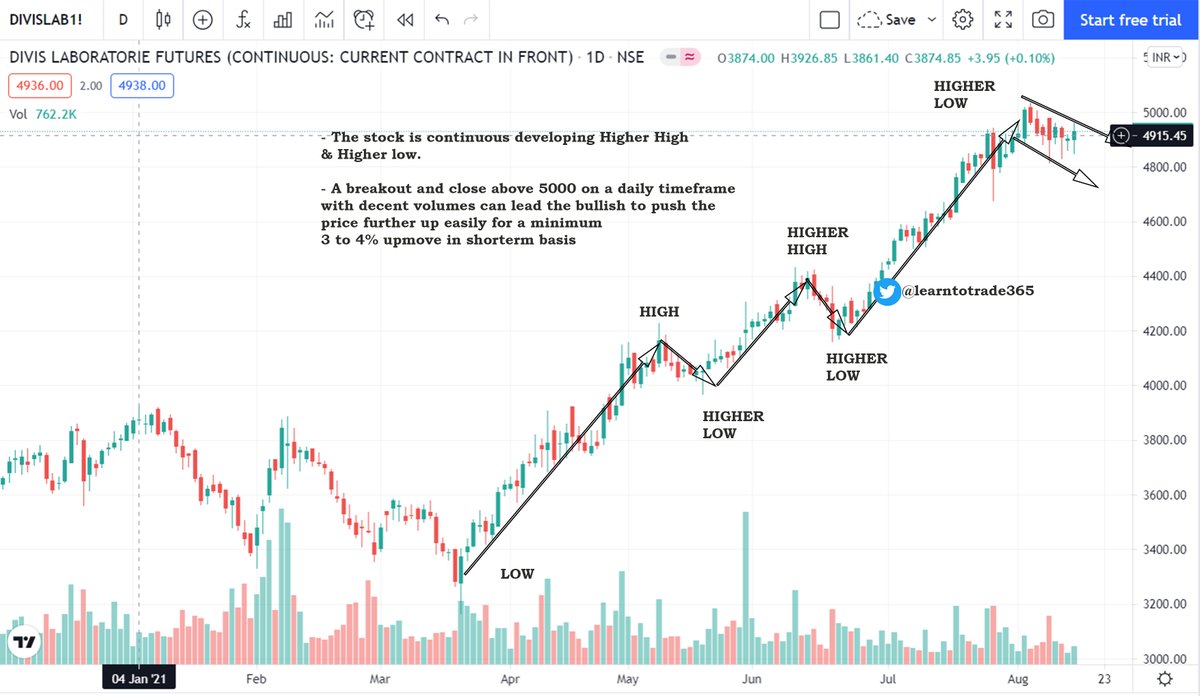
Low debt, High ROCE & Earnings growth, High cash flows and buzzing business in which the company is a leader makes it a classical compounder!
Chart Attached! pic.twitter.com/euIpcfGwQq





You May Also Like











1/OK, data mystery time.
This New York Times feature shows China with a Gini Index of less than 30, which would make it more equal than Canada, France, or the Netherlands. https://t.co/g3Sv6DZTDE
That's weird. Income inequality in China is legendary.
Let's check this number.
2/The New York Times cites the World Bank's recent report, "Fair Progress? Economic Mobility across Generations Around the World".
The report is available here:
3/The World Bank report has a graph in which it appears to show the same value for China's Gini - under 0.3.
The graph cites the World Development Indicators as its source for the income inequality data.

4/The World Development Indicators are available at the World Bank's website.
Here's the Gini index: https://t.co/MvylQzpX6A
It looks as if the latest estimate for China's Gini is 42.2.
That estimate is from 2012.
5/A Gini of 42.2 would put China in the same neighborhood as the U.S., whose Gini was estimated at 41 in 2013.
I can't find the <30 number anywhere. The only other estimate in the tables for China is from 2008, when it was estimated at 42.8.
This New York Times feature shows China with a Gini Index of less than 30, which would make it more equal than Canada, France, or the Netherlands. https://t.co/g3Sv6DZTDE
That's weird. Income inequality in China is legendary.
Let's check this number.
2/The New York Times cites the World Bank's recent report, "Fair Progress? Economic Mobility across Generations Around the World".
The report is available here:
3/The World Bank report has a graph in which it appears to show the same value for China's Gini - under 0.3.
The graph cites the World Development Indicators as its source for the income inequality data.
4/The World Development Indicators are available at the World Bank's website.
Here's the Gini index: https://t.co/MvylQzpX6A
It looks as if the latest estimate for China's Gini is 42.2.
That estimate is from 2012.
5/A Gini of 42.2 would put China in the same neighborhood as the U.S., whose Gini was estimated at 41 in 2013.
I can't find the <30 number anywhere. The only other estimate in the tables for China is from 2008, when it was estimated at 42.8.