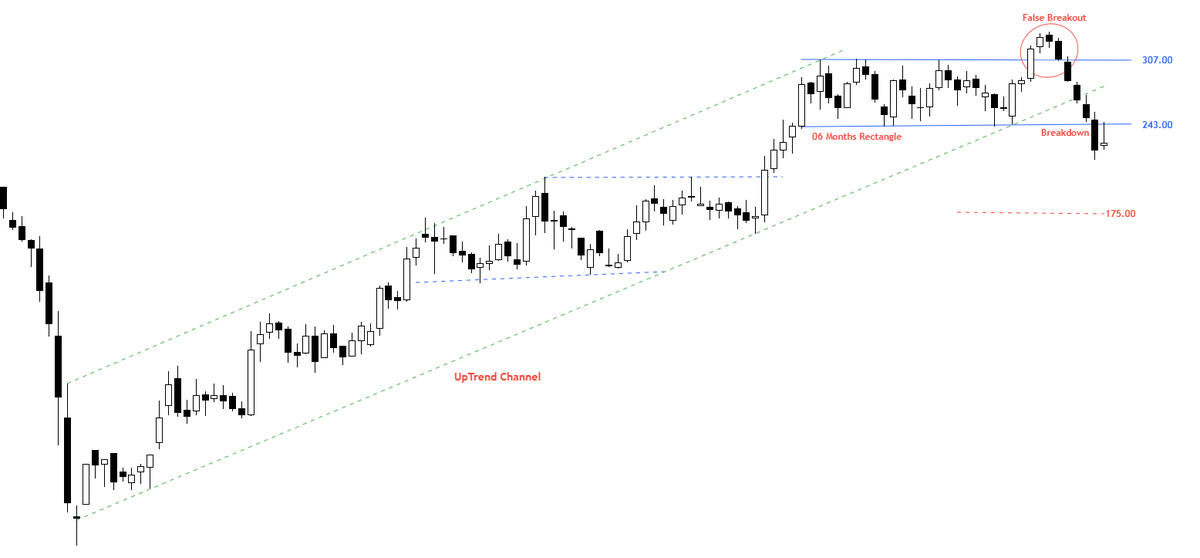
When price break any well defined boundary below 200 Day Moving Average then high probability price continue the Trend .
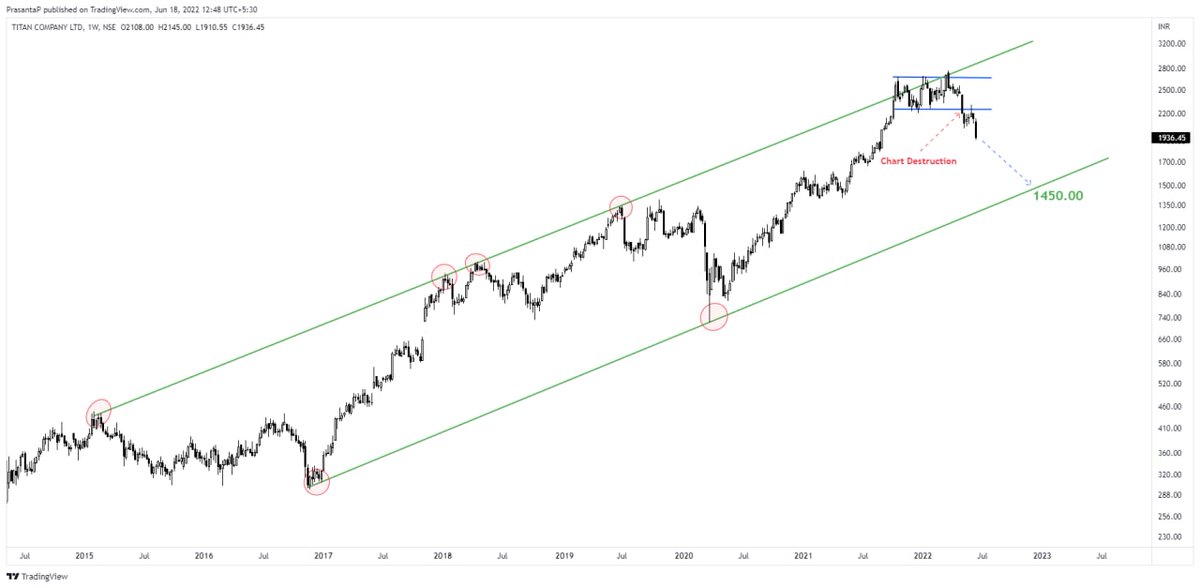
#DELTACORP weekly chart setup
#sharemarket #StockMarket @shivaji_1983 @kuttrapali26 @moneyworks4u_fa #trading
More from Prasanta Pradhan 🇮🇳
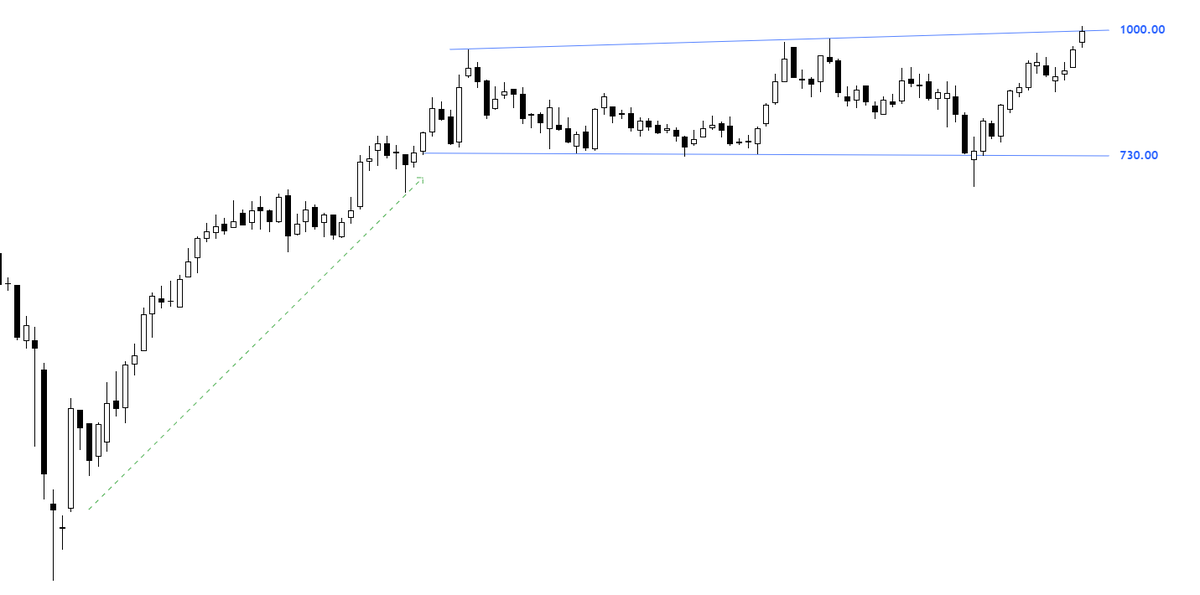
Price provides additional benefit if we enter near a well defined boundary above 200 DMA , after any reversal candle .
Near well defined support our work is only Manage the risk and qty .
#tatapower update chart setup
#Investment #stocks #StockMarket https://t.co/Wkv8YDSFJ6
Near well defined support our work is only Manage the risk and qty .
#tatapower update chart setup
#Investment #stocks #StockMarket https://t.co/Wkv8YDSFJ6
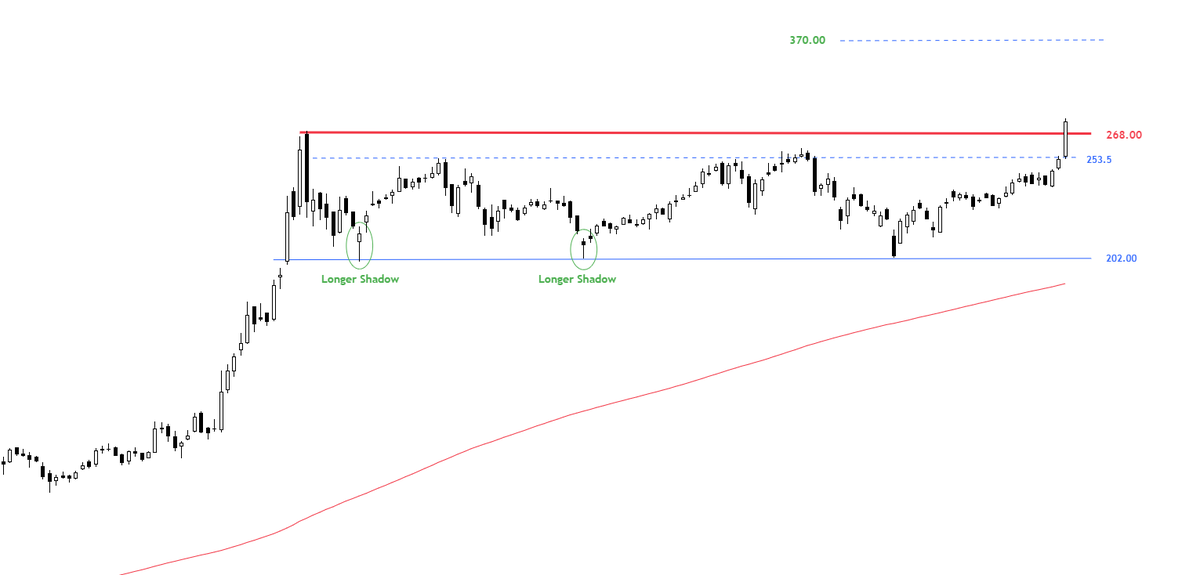
#tatapower chart #update
— Prasanta Pradhan \U0001f1ee\U0001f1f3 (@Mysterychart) March 29, 2022
I just love horizontal boundary #Investment #investing #StockMarket https://t.co/rfuzNq2Peq pic.twitter.com/5LtHjp6UCy
You May Also Like
1/OK, data mystery time.
This New York Times feature shows China with a Gini Index of less than 30, which would make it more equal than Canada, France, or the Netherlands. https://t.co/g3Sv6DZTDE
That's weird. Income inequality in China is legendary.
Let's check this number.
2/The New York Times cites the World Bank's recent report, "Fair Progress? Economic Mobility across Generations Around the World".
The report is available here:
3/The World Bank report has a graph in which it appears to show the same value for China's Gini - under 0.3.
The graph cites the World Development Indicators as its source for the income inequality data.
4/The World Development Indicators are available at the World Bank's website.
Here's the Gini index: https://t.co/MvylQzpX6A
It looks as if the latest estimate for China's Gini is 42.2.
That estimate is from 2012.
5/A Gini of 42.2 would put China in the same neighborhood as the U.S., whose Gini was estimated at 41 in 2013.
I can't find the <30 number anywhere. The only other estimate in the tables for China is from 2008, when it was estimated at 42.8.