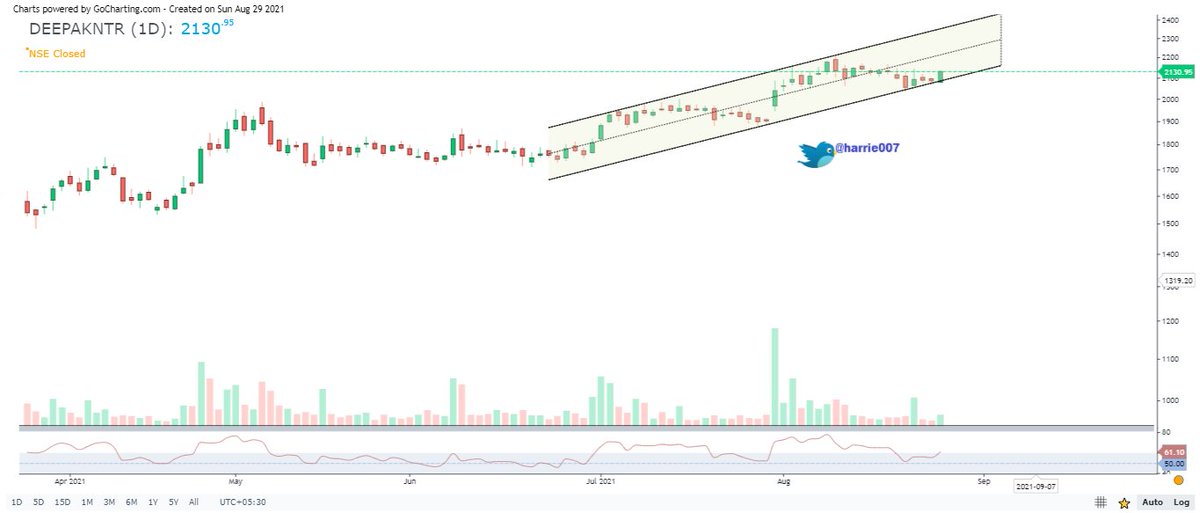
Deepak Nitrite - Bought more of them. Weakness below 1820.

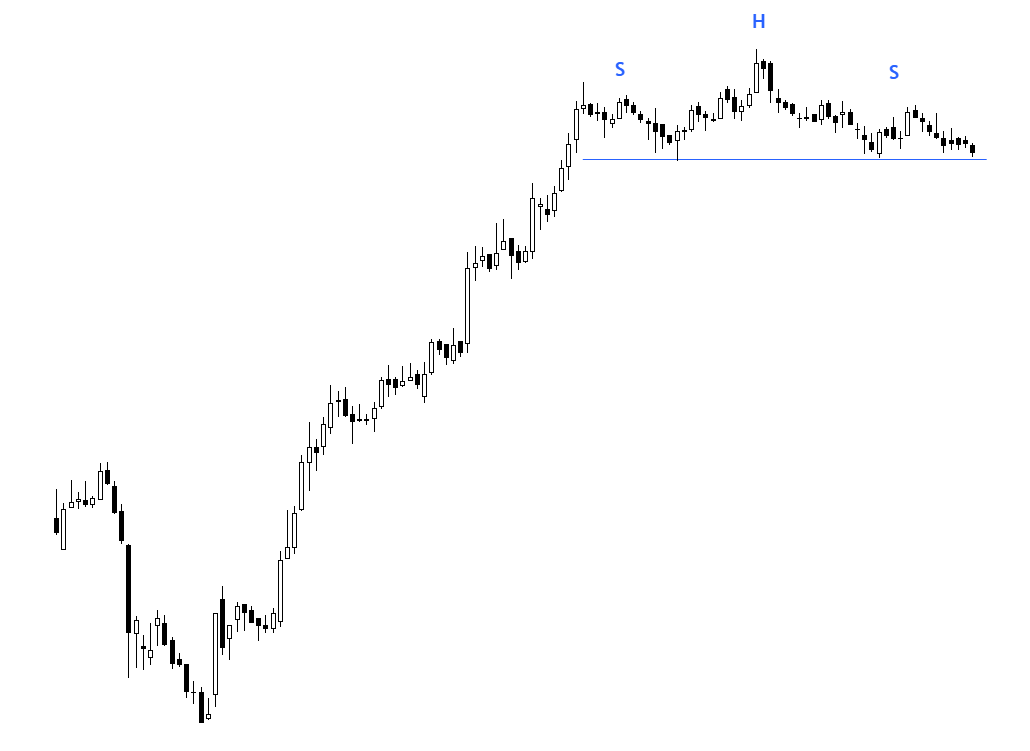
More from Steve Nison
Borosil renewables - Enter if you can. Read the below tweet to understand the concept. The only way you can make money is to follow in the footsteps of smart money till you yourself become a smart operator. 👇👇 https://t.co/RN8sQYzdBg
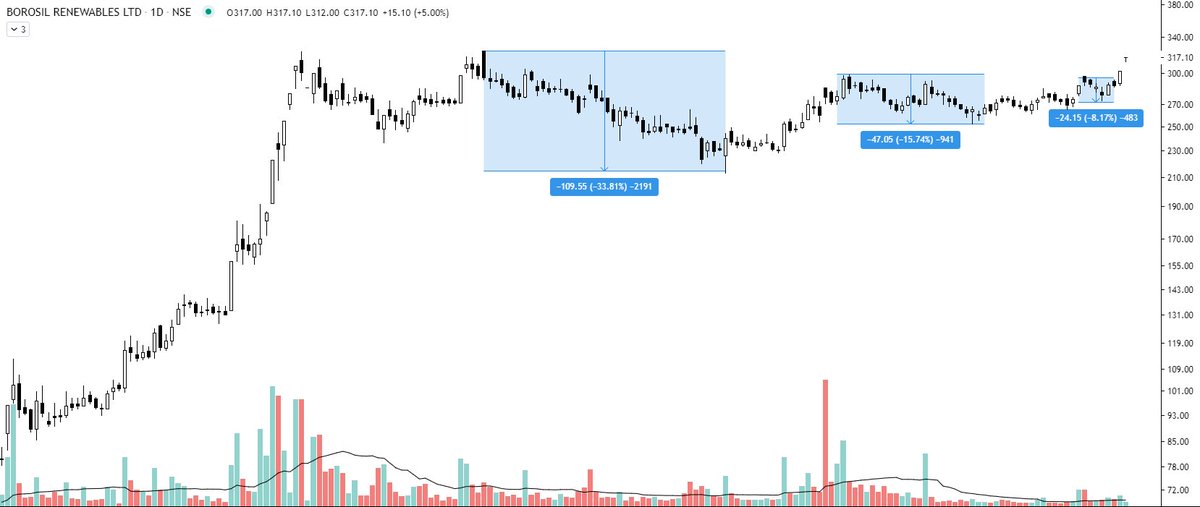
Borosil Renewables - Patterns like these must be looked at carefully and must be kept on the radar. Herein price is contracting which generally signifies shifting of hands (from weak to strong). If you go wrong, the risk is limited in these. pic.twitter.com/iqyoeslZjy
— Steve Nison (@nison_steve) July 12, 2021
Reminded me of my Borosil renewables chart of last year in July.
AWL - look at the ranges of contraction on the chart https://t.co/2XMhqZQu8X
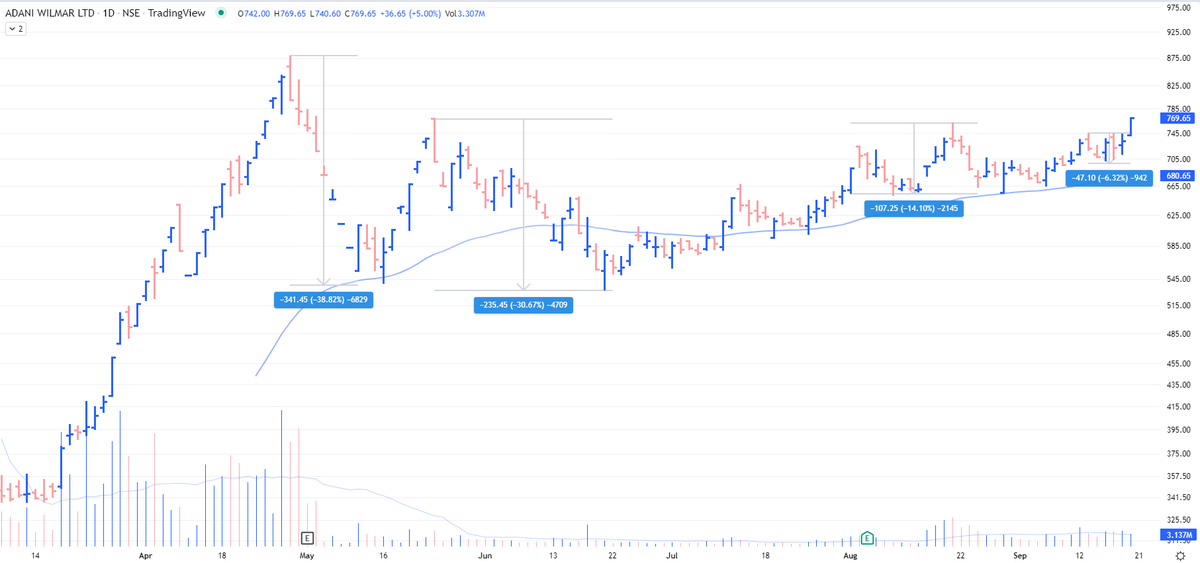
AWL - look at the ranges of contraction on the chart https://t.co/2XMhqZQu8X
Borosil Renewables - Patterns like these must be looked at carefully and must be kept on the radar. Herein price is contracting which generally signifies shifting of hands (from weak to strong). If you go wrong, the risk is limited in these. pic.twitter.com/iqyoeslZjy
— The_Chartist \U0001f4c8 (@charts_zone) July 12, 2021
More from Deepaknitrate


DEEPAKNTR
Double Top Buy & T20 Pattern - Bullish above 2189.89 daily close on 1% Box Size Chart. https://t.co/dEAqzILJj4
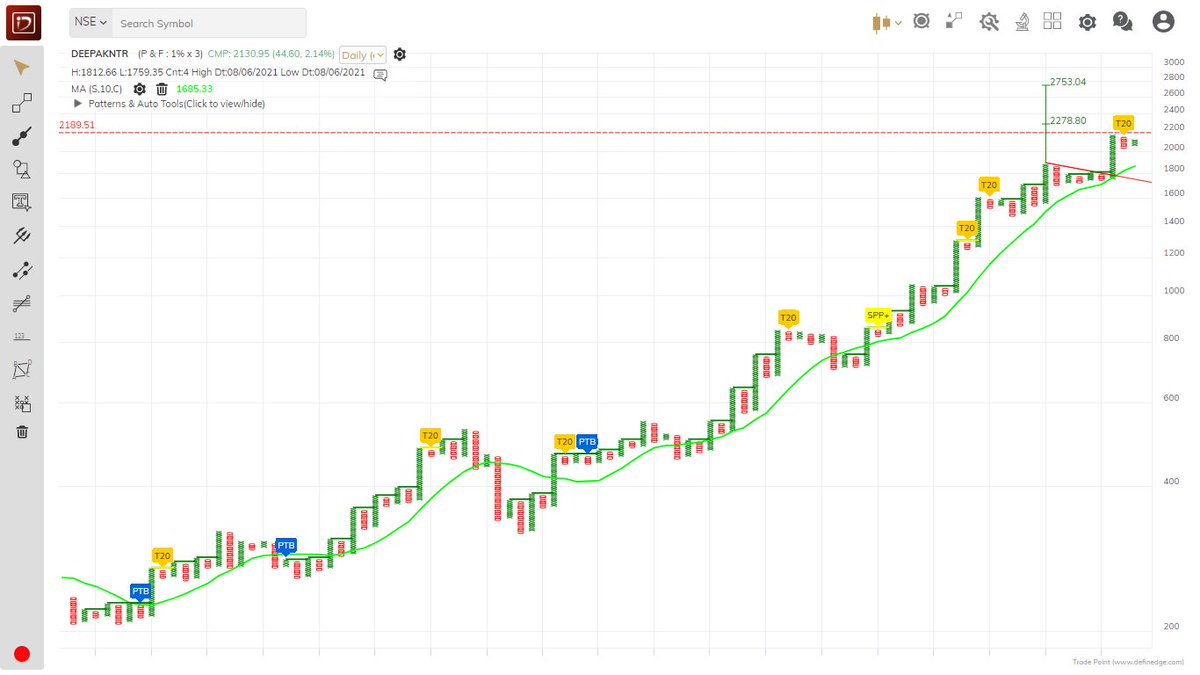
Double Top Buy & T20 Pattern - Bullish above 2189.89 daily close on 1% Box Size Chart. https://t.co/dEAqzILJj4
DEEPAKNTR
— Saket Reddy (@saketreddy) March 30, 2021
Double Top Buy & ABC Breakout above 1608.64 daily close on 1% Box size chart & Double Top Buy active on 3% Box size chart.
2000 Coming! https://t.co/ifywtsGM0S pic.twitter.com/VM7TneVwOr


You May Also Like


1/OK, data mystery time.
This New York Times feature shows China with a Gini Index of less than 30, which would make it more equal than Canada, France, or the Netherlands. https://t.co/g3Sv6DZTDE
That's weird. Income inequality in China is legendary.
Let's check this number.
2/The New York Times cites the World Bank's recent report, "Fair Progress? Economic Mobility across Generations Around the World".
The report is available here:
3/The World Bank report has a graph in which it appears to show the same value for China's Gini - under 0.3.
The graph cites the World Development Indicators as its source for the income inequality data.

4/The World Development Indicators are available at the World Bank's website.
Here's the Gini index: https://t.co/MvylQzpX6A
It looks as if the latest estimate for China's Gini is 42.2.
That estimate is from 2012.
5/A Gini of 42.2 would put China in the same neighborhood as the U.S., whose Gini was estimated at 41 in 2013.
I can't find the <30 number anywhere. The only other estimate in the tables for China is from 2008, when it was estimated at 42.8.
This New York Times feature shows China with a Gini Index of less than 30, which would make it more equal than Canada, France, or the Netherlands. https://t.co/g3Sv6DZTDE
That's weird. Income inequality in China is legendary.
Let's check this number.
2/The New York Times cites the World Bank's recent report, "Fair Progress? Economic Mobility across Generations Around the World".
The report is available here:
3/The World Bank report has a graph in which it appears to show the same value for China's Gini - under 0.3.
The graph cites the World Development Indicators as its source for the income inequality data.
4/The World Development Indicators are available at the World Bank's website.
Here's the Gini index: https://t.co/MvylQzpX6A
It looks as if the latest estimate for China's Gini is 42.2.
That estimate is from 2012.
5/A Gini of 42.2 would put China in the same neighborhood as the U.S., whose Gini was estimated at 41 in 2013.
I can't find the <30 number anywhere. The only other estimate in the tables for China is from 2008, when it was estimated at 42.8.