2 different frames or metaphors for #CyberSecurity
Security as a Quality Management issue thus a problem of robustness
Security as a Safety issue thus a problem of resilience
They’re fundamentally different, may even be at odds but how ?
🧵
But this is also a cautionary tale. If you don’t have the capacity to deal with expected adverse conditions,
So until you get to the point where your robustness is sound, this is the metaphor that is most appropriate and which can be argued for economically
When you get here, a metaphor of Security as Safety is likely more appropriate. You’ve now dealt with the robustness of components and put in the measures which are
You’re now building for resilience and sustained adaptive capacity
“But can I do both?” You ask
Remember that sources of resilience in orgs are in our people. They’re the ones dealing with the variability our systems and automation can’t handle, so applying principles of learning
You May Also Like
Nano Course On Python For Trading
==========================
Module 1
Python makes it very easy to analyze and visualize time series data when you’re a beginner. It's easier when you don't have to install python on your PC (that's why it's a nano course, you'll learn python...
... on the go). You will not be required to install python in your PC but you will be using an amazing python editor, Google Colab Visit https://t.co/EZt0agsdlV
This course is for anyone out there who is confused, frustrated, and just wants this python/finance thing to work!
In Module 1 of this Nano course, we will learn about :
# Using Google Colab
# Importing libraries
# Making a Random Time Series of Black Field Research Stock (fictional)
# Using Google Colab
Intro link is here on YT: https://t.co/MqMSDBaQri
Create a new Notebook at https://t.co/EZt0agsdlV and name it AnythingOfYourChoice.ipynb
You got your notebook ready and now the game is on!
You can add code in these cells and add as many cells as you want
# Importing Libraries
Imports are pretty standard, with a few exceptions.
For the most part, you can import your libraries by running the import.
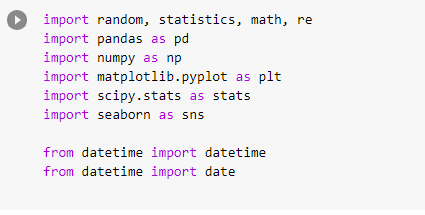
Type this in the first cell you see. You need not worry about what each of these does, we will understand it later.


