RISHI PINGALA:THE ANCIENT INDIAN SAGE DISCREDITED FOR HIS MAJOR CONTRIBUTIONS TO MATHEMATICS & PHI
Have you ever heard about,"The Golden Ratio"?
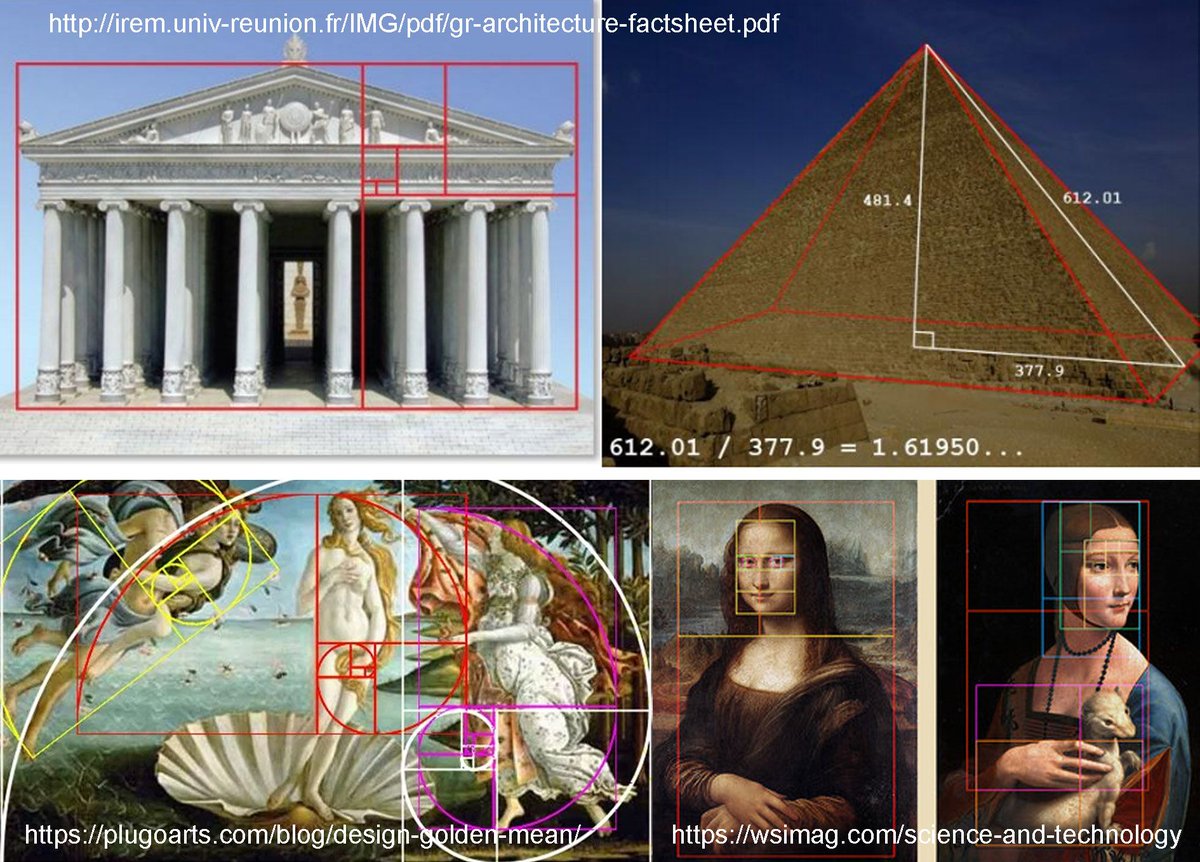
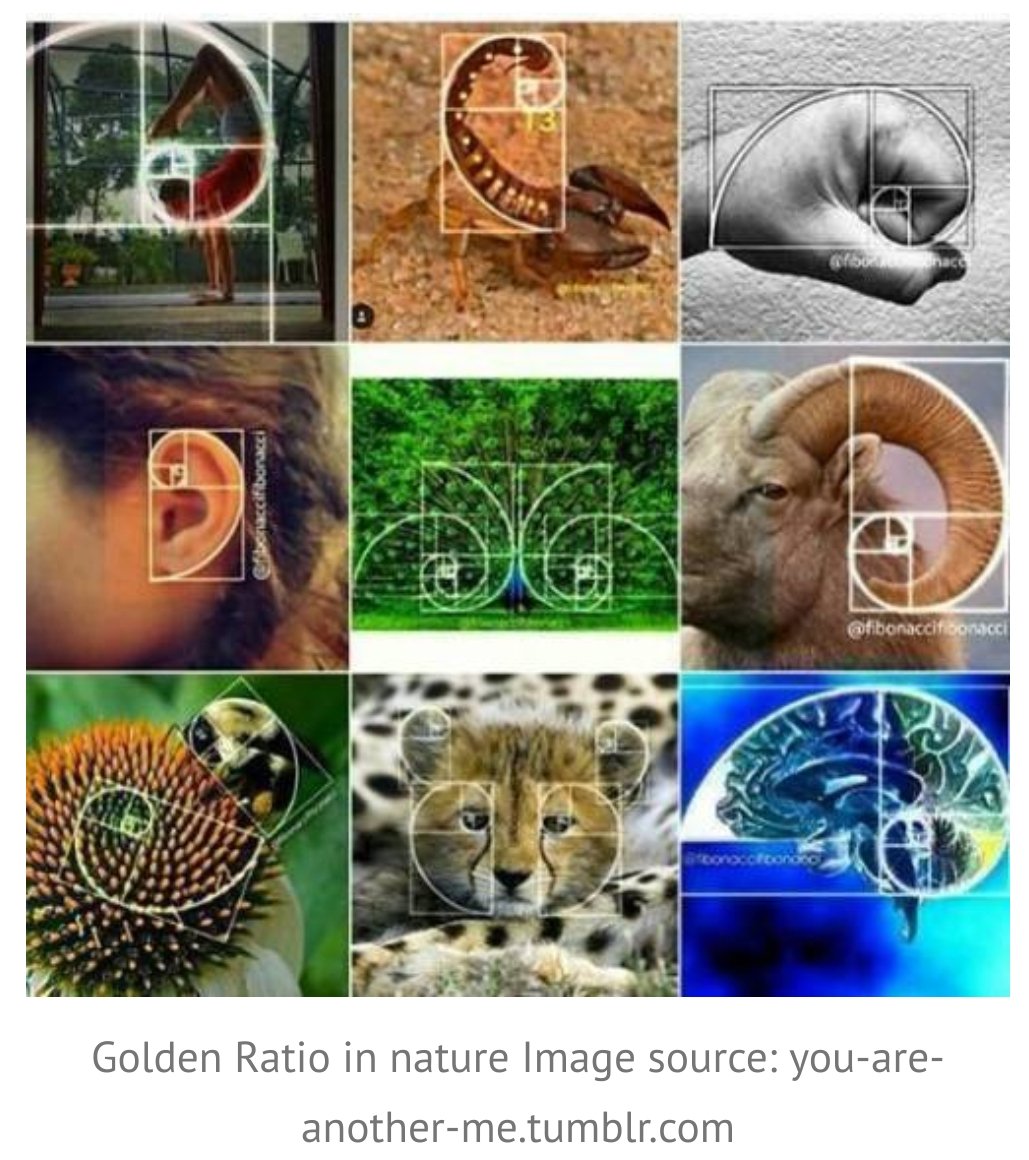
The Golden Ratio or Phi(Greek) is a mathematical ratio of nature. Mother Nature is the most exquisite artist in herself.
&Its this Phi she uses to create all the beauty in World.
If anyone uses this ratio correctly in their art,it can turn into a spell-binding piece of work.Such is the significance of'Phi'.But my thread isn't about it.Its about somethin called'Fibonacci Series'&who actually made it
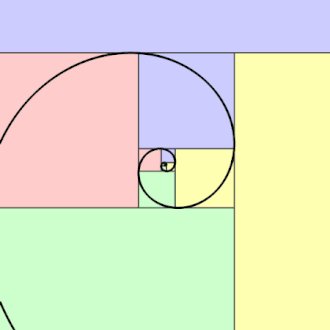
Phi is related to Fibonacci series(0,1,1,2,3,5,8,13,21,34...)
&this series is responsible for everything dat is beautiful on this planet. Just try to calculate the ratio of any 2 successive numbers ÷ each of them by the number before it in above infinite series.
E.g. 3/2=1.5, 5/3=1.666, 8/5=1.6, 34/21=1.61904 and so on. Did you notice something? The ratio is coming almost same every time. This ratio is called 'Phi 'which is numerically represented as 1:1.618. This Golden Spiral is made in exact proportion of 1:1.618.
The thing I want to emphasize here is that we always find only those things appealing and attractive that have Phi. It's in our subconscious. Isn't it some revelation? We are the part of this Divine proportion of the God or the Mother Nature. Check these: