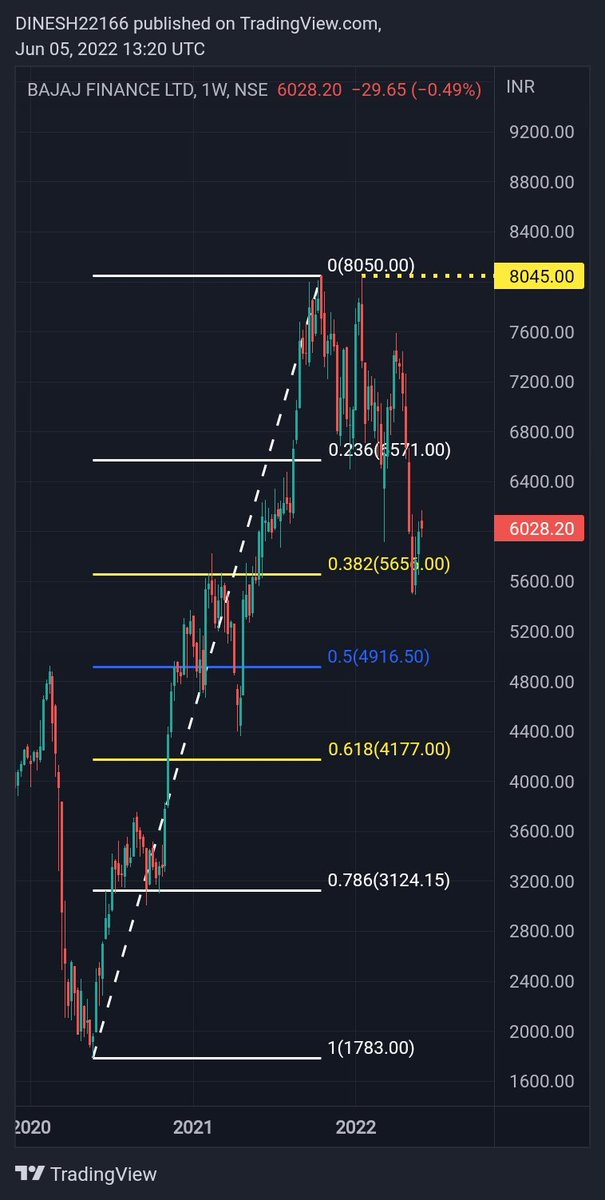
#BAJFINANCE -
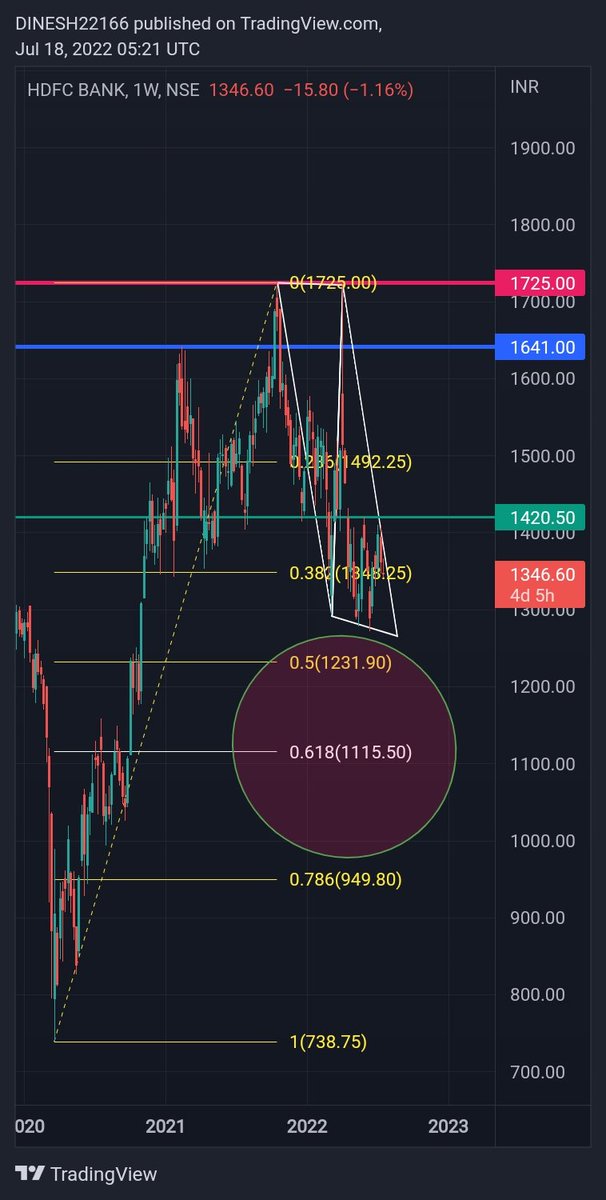
Fibonacci retracement level shown in chart.
Best opportunity (0.382%-0.50%- 0.618%) correction if any.
#Perspective
More from Waves_Perception(Dinesh Patel) मैंSchedule Tribe)
Either entry only above 1600 or let it
correct towards 987...
#Update
#CDSL -1050
— MaRkET WaVES (DINESH PATEL ) Stock Market FARMER (@idineshptl) July 9, 2021
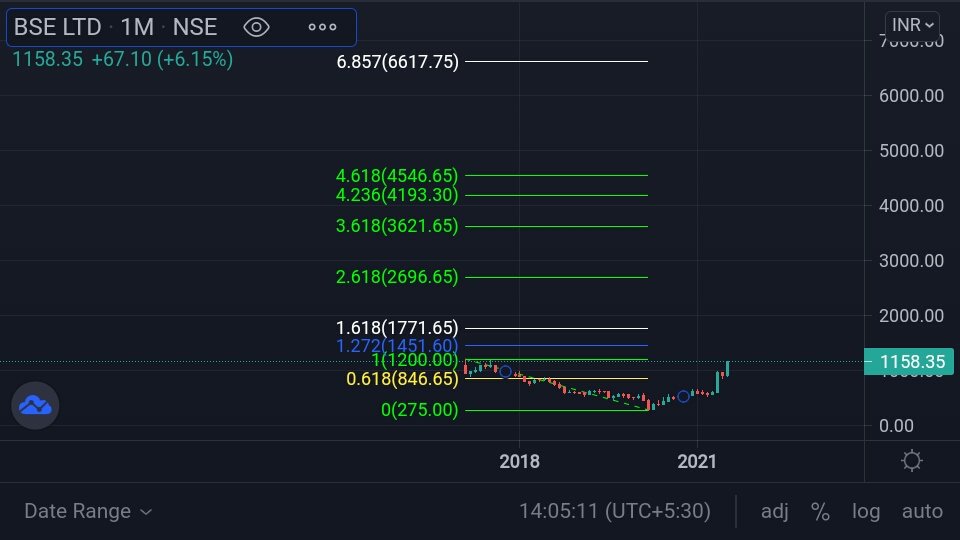
Now above 2.618% and objective is to move higher towards 3.618%
4.236% and 4.618%....
What will Drag lower this stock price \U0001f602 ?
Only if you can sell your holding
Means Verticle rise ?
Than why it decline from (486-180.)#Observation #Perspective pic.twitter.com/evxYOjH8Qv
More from Bajajfinancelongterm
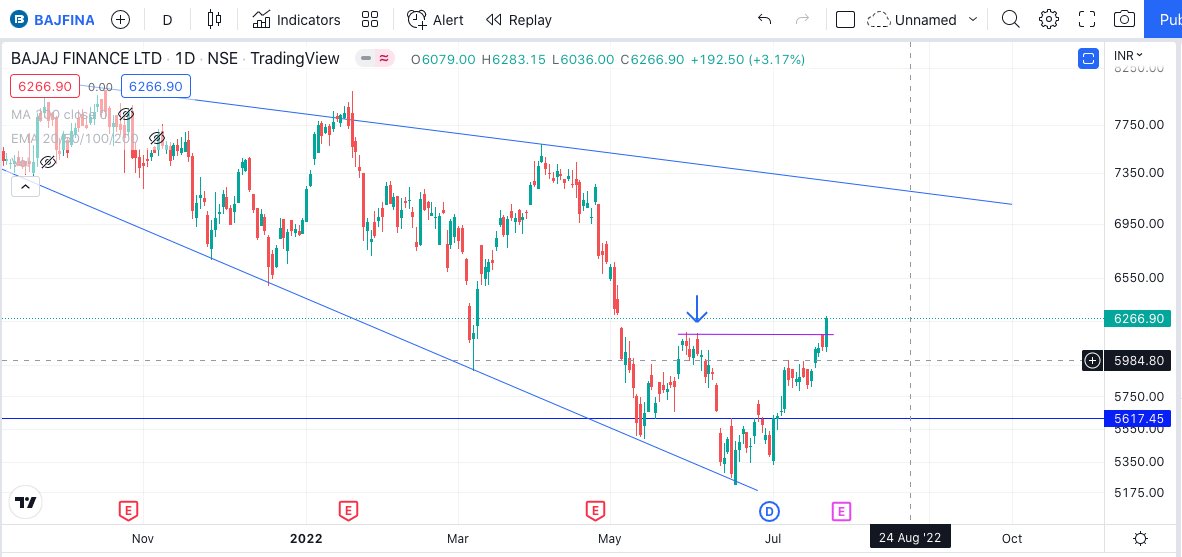
Bajaj Finance cmp 6266, Breakout of double bottom pattern with bullish RSI divergence.
— The Anonymous Trader (@Anony_mous_Bull) July 22, 2022
Expecting levels of 6500/6750/ 7000. Support at zone of 5800-6000. Keep on radar.#BajajFinance #StockMarketindia #stocks #investing #Nifty #BREAKOUTSTOCKS pic.twitter.com/a5N0oj549T
An "ABC" correction ended & "C" wave's "12345" ended in this highly traded stock.
#Elliottwave captures Nature's law, human actions in a collective way
and,
in Top gainers' https://t.co/9bw8A0tgUp
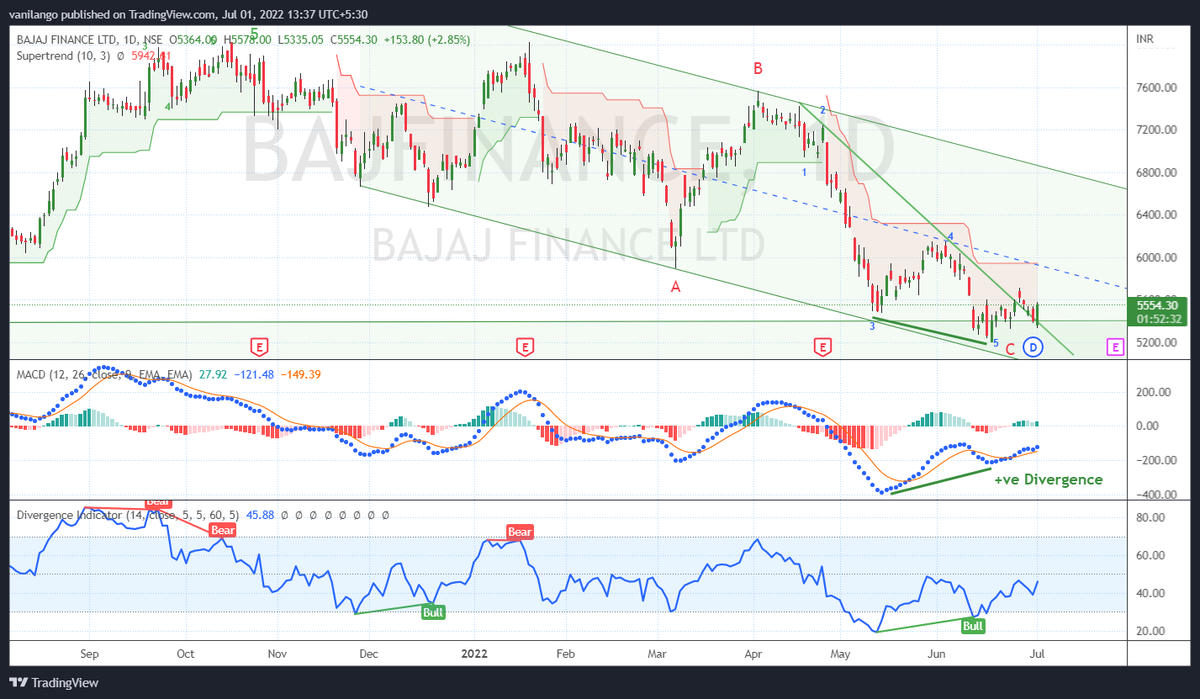
#bajfinance is almost @ sloping channel bottom & has entered the demand zone.
— Van ilango (JustNifty) (@JustNifty) June 22, 2022
One of few stocks that are displaying +ve #Divergence in "Day t/f"
"ABC" correction "almost" done.
Above 5650, mild strength. https://t.co/IJlQ0GKtN3 pic.twitter.com/4uqY0DRqiW
You May Also Like
A small tribute/gift to members
Screeners
technical screeners - intraday and positional both
before proceeding - i have helped you , can i ask you so that it can help someone else too
thank you
positional one
run - find #stock - draw chart - find levels
1- Stocks closing daily 2% up from 5 days
https://t.co/gTZrYY3Nht
2- Weekly breakout
https://t.co/1f4ahEolYB
3- Breakouts in short term
https://t.co/BI4h0CdgO2
4- Bullish from last 5
intraday screeners
5- 15 minute Stock Breakouts
https://t.co/9eAo82iuNv
6- Intraday Buying seen in the past 15 minutes
https://t.co/XqAJKhLB5G
7- Stocks trading near day's high on 5 min chart with volume BO intraday
https://t.co/flHmm6QXmo
Thank you


