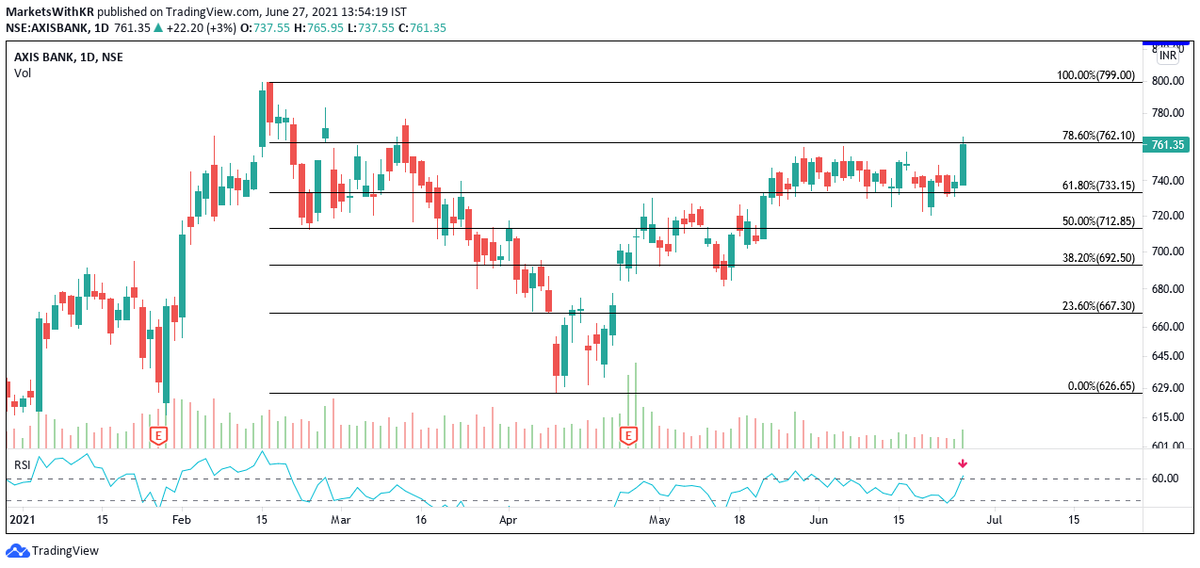
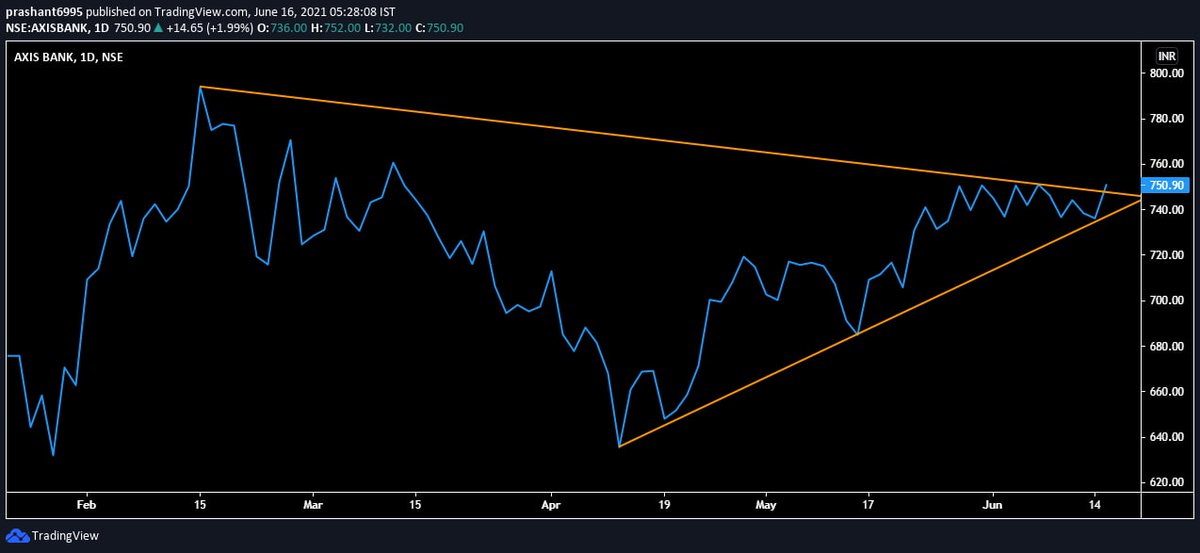
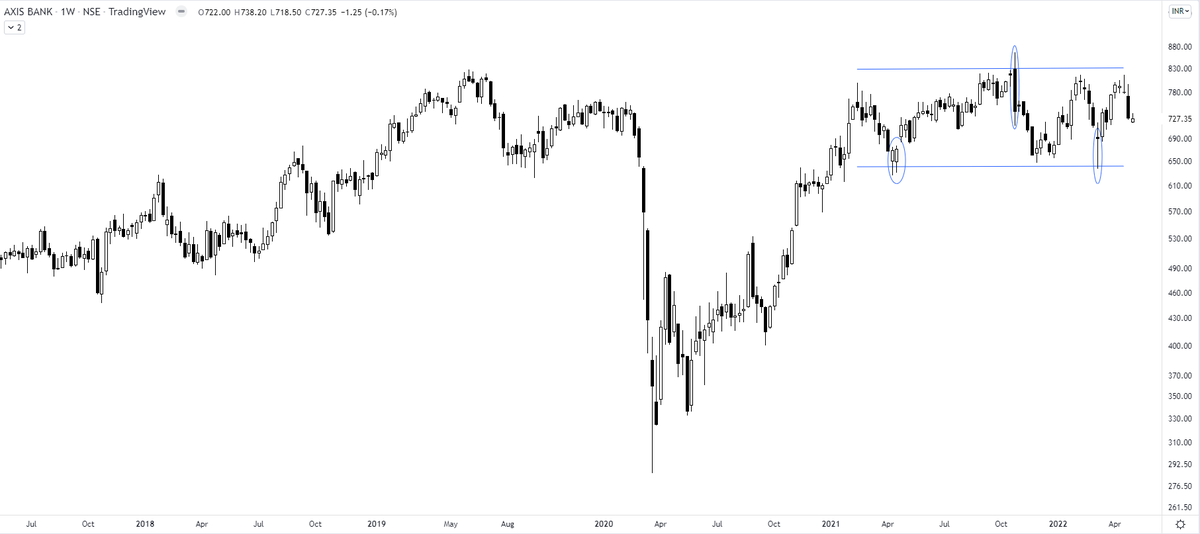
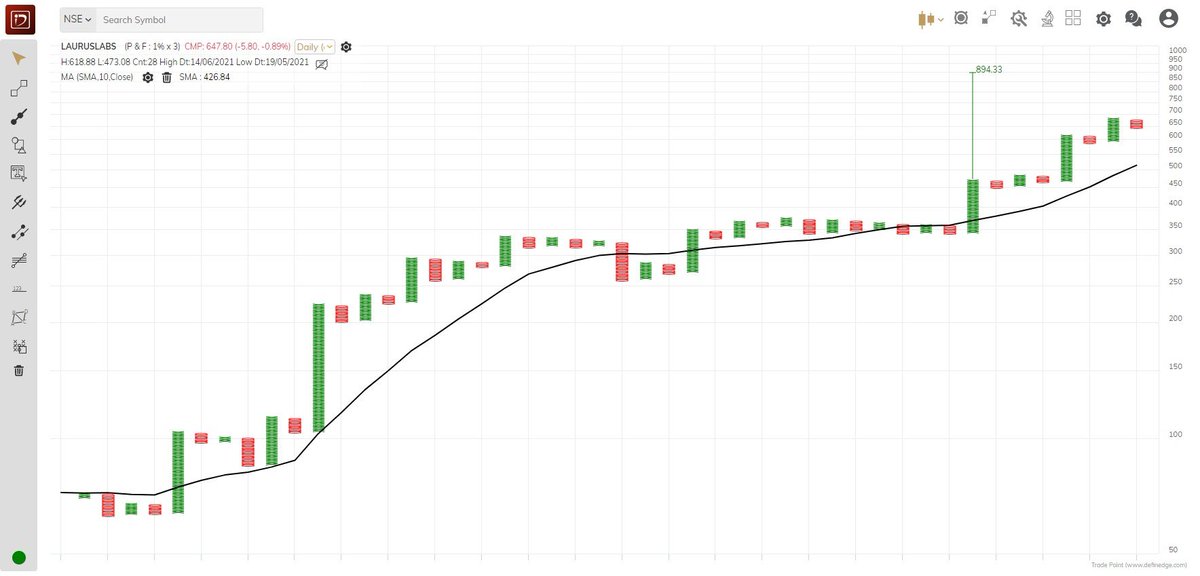
The chart pattern working on a larger timeframe gives a broad perspective on the direction of the security and is easy to trade once you get a breakout. the easy way is to set the price alert & make money elsewhere.
Axis Bank
More from The_Chartist 📈
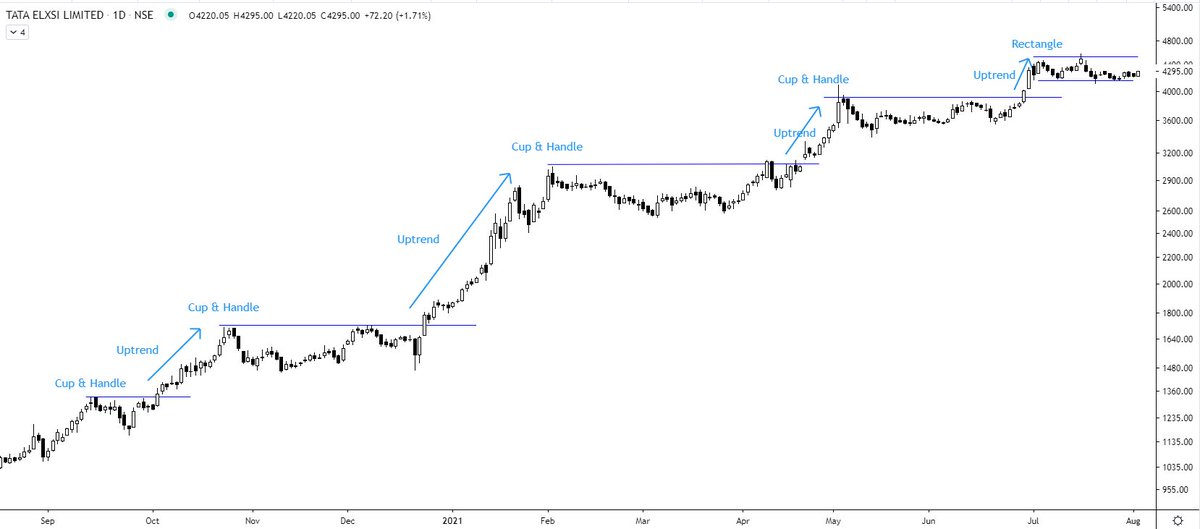
Tata Elxsi (W) - near to the resistance zone again 5th time. @nishkumar1977 @suru27 @rohanshah619 @indian_stockss @sanstocktrader @BissaGauravB @RajarshitaS @PAVLeader @Rishikesh_ADX @VijayThk @Investor_Mohit @TrendTrader85 @jitendra_stock pic.twitter.com/aIC5kO8XqA
— Steve Nison (@nison_steve) December 18, 2020
Russell 2000
It is better if you spend considerable time learning these concepts. https://t.co/caBHOO4Owa
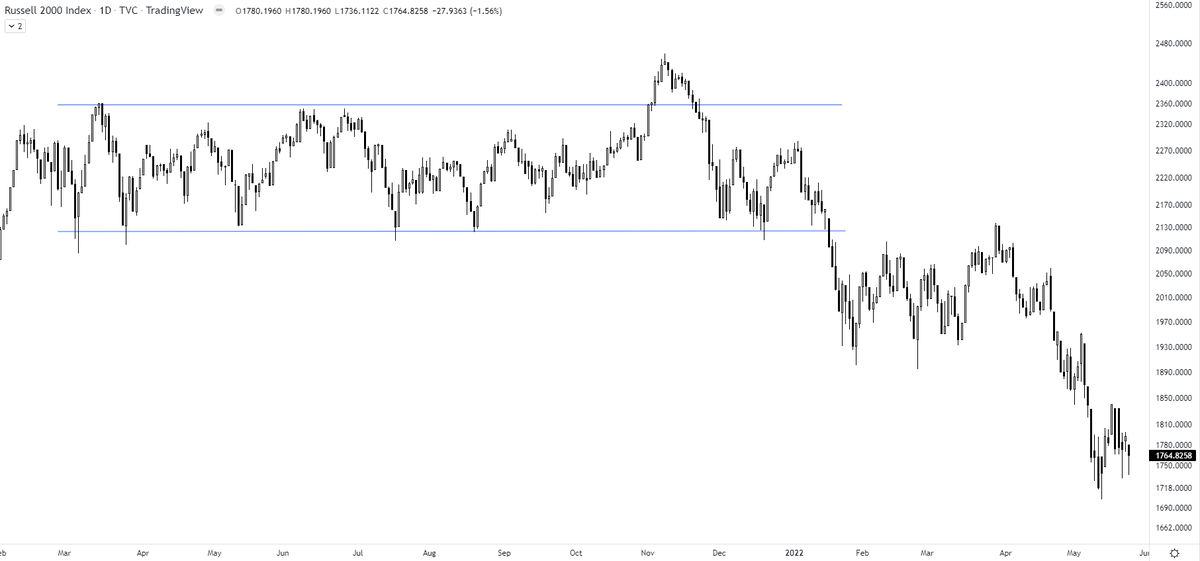
TRAPS? In a false breakout, the price breaks out of the range & comes back within the range. A trap is one step ahead, price not only comes back within the range but breaks down in the opposite direction. It traps the initial longs who didn't close their positions
— The_Chartist \U0001f4c8 (@charts_zone) January 22, 2022
Russell 2000 pic.twitter.com/txzjdnStzc
This exercise will tell you about your inherent strengths & weaknesses. 👇👇
How to record a trading journal (TJ) & what to analyze?
— The_Chartist \U0001f4c8 (@charts_zone) December 14, 2021
What is in a TJ?
Buy Date
Stock Name
The time frame you analyzed (D/W/M)
Long/Short?
Buy Price
SL
Sell Price
Risk took (% of capital)
Sell date
No. of days held
P/L
P/L as % of capital
Buy Reason?
Invested capital/trade pic.twitter.com/WnrvmYuOV0