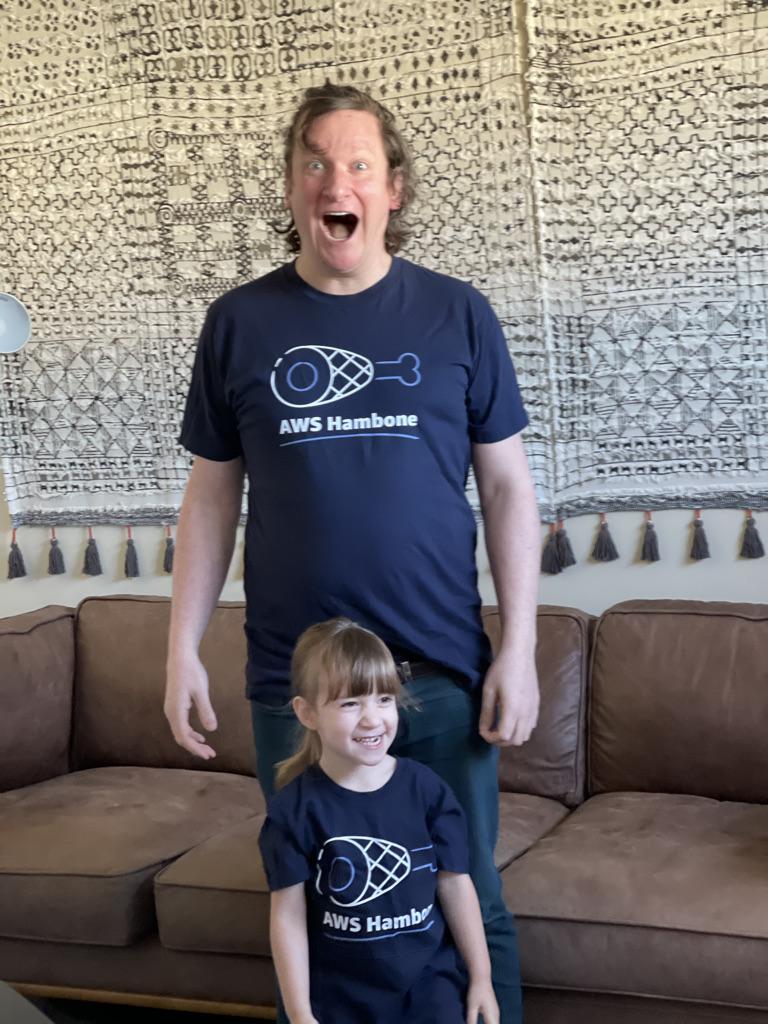
Lest people think I've become too far lost in the Talking Head weeds this past #reinvent week, it's now time for me to livetweet my use of a new AWS service that was announced this week.


Much like a typical customer, I ignore that nonsense and disable the thing with the word "security" in it.

No, I'm not misusing the term "feature branch."

Github tells me this app is 60.6% Python, 39.4% HTML.
98 commits, dating back to my initial commit in October of 2017.

This is of course a screaming red flag that this service is fake, or else my code is so bad that it's not even recognized as Python.


I add two more repos and start analyzing them.


I suspect that it wound up looking at a bunch of code and making some assumptions, like "if the author is 'Stephen' the code is shitty."
I'll be expecting a job offer early next week.


More from Corey Quinn


You May Also Like


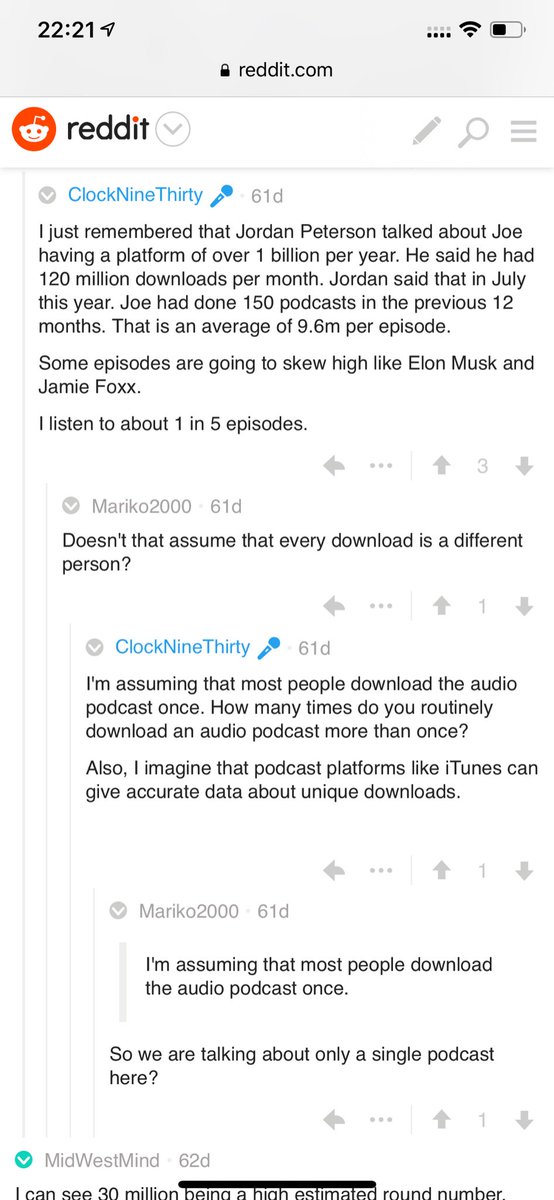
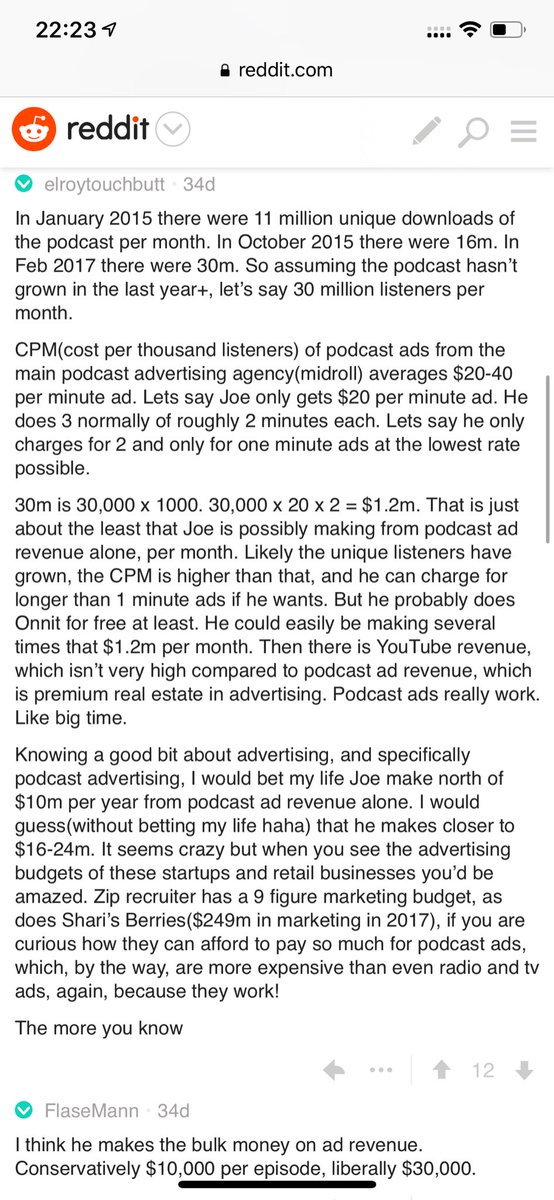
Joe Rogan's podcast is now is listened to 1.5+ billion times per year at around $50-100M/year revenue.
Independent and 100% owned by Joe, no networks, no middle men and a 100M+ people audience.
👏
https://t.co/RywAiBxA3s
Joe is the #1 / #2 podcast (depends per week) of all podcasts
120 million plays per month source https://t.co/k7L1LfDdcM
https://t.co/aGcYnVDpMu
Independent and 100% owned by Joe, no networks, no middle men and a 100M+ people audience.
👏
https://t.co/RywAiBxA3s
Joe is the #1 / #2 podcast (depends per week) of all podcasts
120 million plays per month source https://t.co/k7L1LfDdcM
https://t.co/aGcYnVDpMu


Took me 5 years to get the best Chartink scanners for Stock Market, but you’ll get it in 5 mminutes here ⏰
Do Share the above tweet 👆
These are going to be very simple yet effective pure price action based scanners, no fancy indicators nothing - hope you liked it.
https://t.co/JU0MJIbpRV
52 Week High
One of the classic scanners very you will get strong stocks to Bet on.
https://t.co/V69th0jwBr
Hourly Breakout
This scanner will give you short term bet breakouts like hourly or 2Hr breakout
Volume shocker
Volume spurt in a stock with massive X times