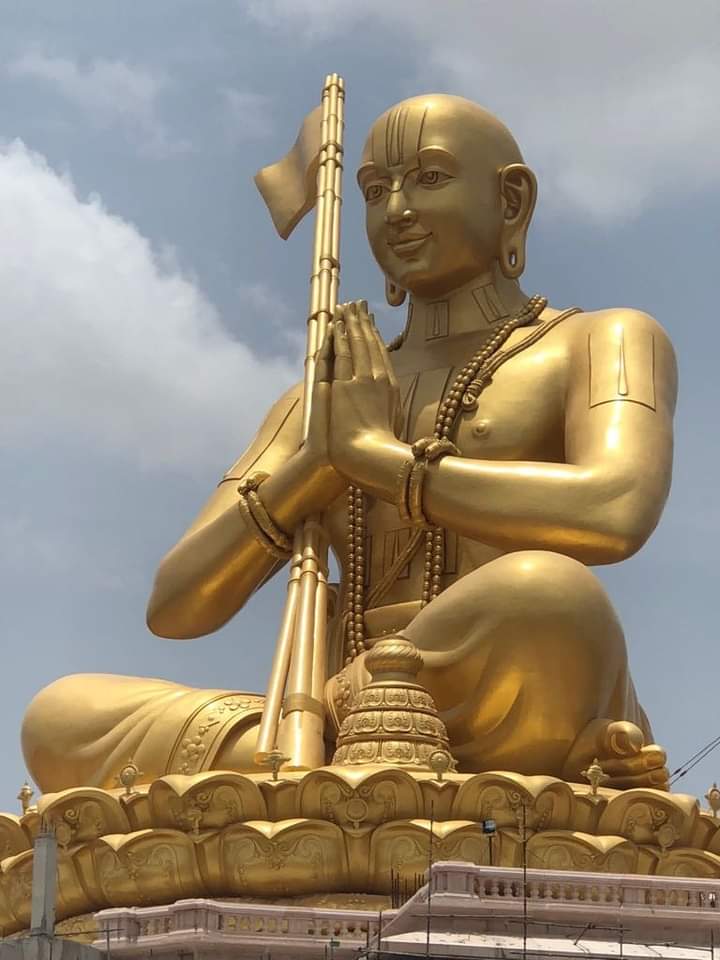
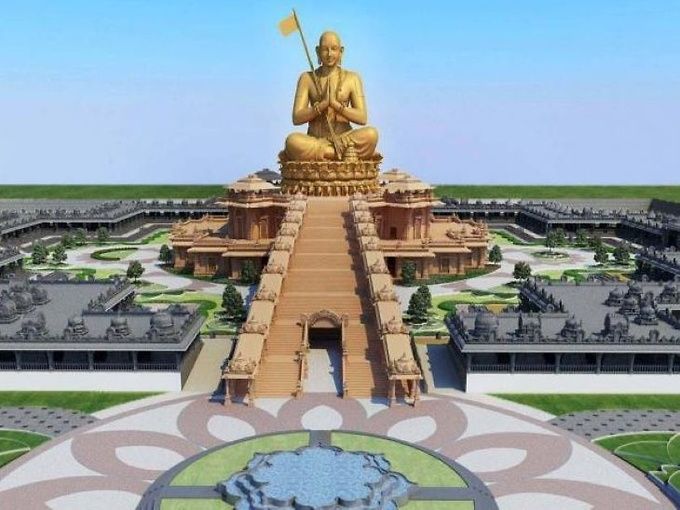
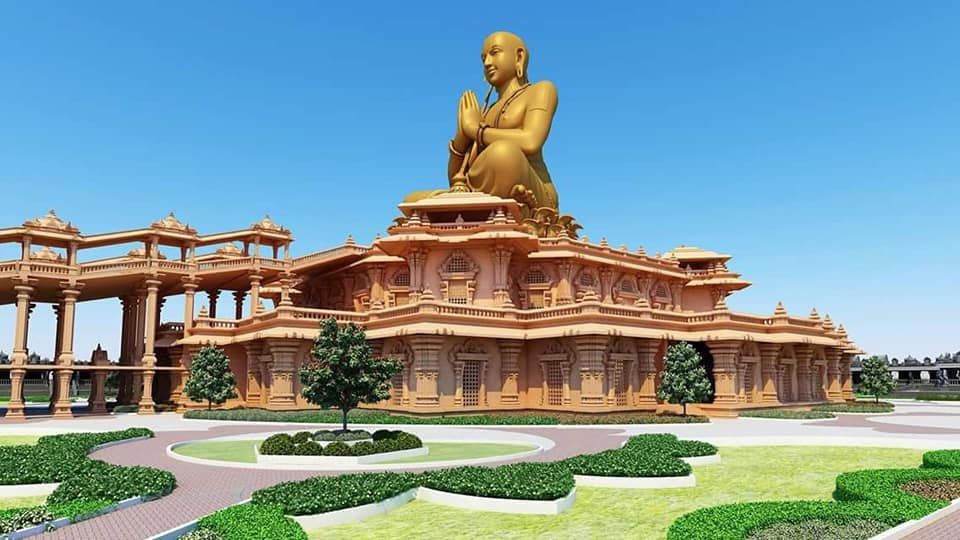
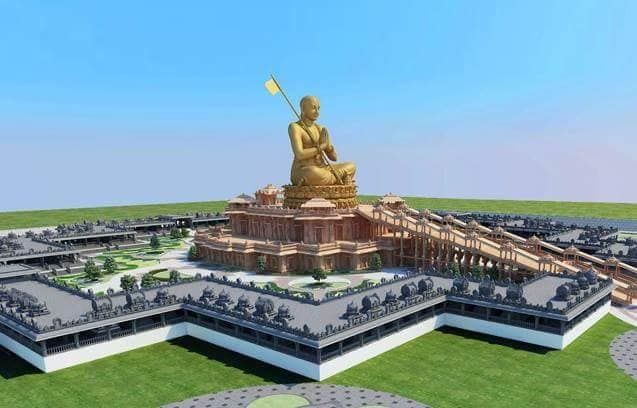
I was watching a video on Fundamental Analysis where the speaker presented a Company's price chart and his theory of how price moves in cycles.

Something clicked and I could correlate the same concepts is being used in the Financial Space

A Thread 🧵
RT if you ♥️

This was a F2F video from @elearnmarkets by @vivbajaj

Mr. Shailendra Kumar explained how he aims to catch a company during the improvement phase and ride it through the rest of improvement, re-rating & story phases.

This curve appears more than you would imagine in any chart!
This is the same curve as interpreted by Stan Weinstein in his Stage Analysis Method.

He looks to Enter stocks in at the break of Stage 1 or at early Stage II, riding the entire momentum and exit at Stage 3.

Sounds Familiar? Lets do more.
Richard Wyckoff interprets the same curve as Accumulation - Distribution stage

The Wyckoff Method seeks specific conditions for positioning usually before Phase A of distribution begins, to be precise, during Phase C / Spring in the accumulation phase.

Same to Same
Then, A relatively unknown guy called
Ralph Nelson Elliott, who developed the Elliott Wave Theory which is based on another unknown guy's theory called Dow Theory, which as it turns out also has a certain shape to his theory on how price moves in Long run!!!

Coincidence?
I guess, at the end of the day, Companies do business by selling products. As it turns out revenues from these products drive prices in the long run or shall I say Expectations of future estimated revenues drives people's behavior in the markets.

Guess what?
Products have a life cycle too & It looks eerily similar to all the charts above! I guess we know why.

Products have the same stages before they fade out. An introduction, Growth Stage, Maturity, Decline :

Different People,
Different Interpretations,
Same Charts!
Feels like this when the entire crew contributes :
RT if you ♥️
Will do a sequel / Continuation Thread to this!

Tagging twitter fam
@jitendrajain @vivbajaj @yogeshnanda1 @theBuoyantMan @AkshayChinchal4 @indiacharts @nishkumar1977 @sanjufunda @ProdigalTrader @TheSagarPareek @mnopro

More from All

MASTER THREAD on Short Strangles.

Curated the best tweets from the best traders who are exceptional at managing strangles.

• Positional Strangles
• Intraday Strangles
• Position Sizing
• How to do Adjustments
• Plenty of Examples
• When to avoid
• Exit Criteria

How to sell Strangles in weekly expiry as explained by boss himself. @Mitesh_Engr

• When to sell
• How to do Adjustments
• Exit


Beautiful explanation on positional option selling by @Mitesh_Engr
Sir on how to sell low premium strangles yourself without paying anyone. This is a free mini course in


1st Live example of managing a strangle by Mitesh Sir. @Mitesh_Engr

• Sold Strangles 20% cap used
• Added 20% cap more when in profit
• Booked profitable leg and rolled up
• Kept rolling up profitable leg
• Booked loss in calls
• Sold only


2nd example by @Mitesh_Engr Sir on converting a directional trade into strangles. Option Sellers can use this for consistent profit.

• Identified a reversal and sold puts

• Puts decayed a lot

• When achieved 2% profit through puts then sold

You May Also Like