2/n
Long-term thoughts about the #crypto market
Get ready to get into a VERY long thread, full of charts.
Popcorns ready? Let's start!
1/n
2/n
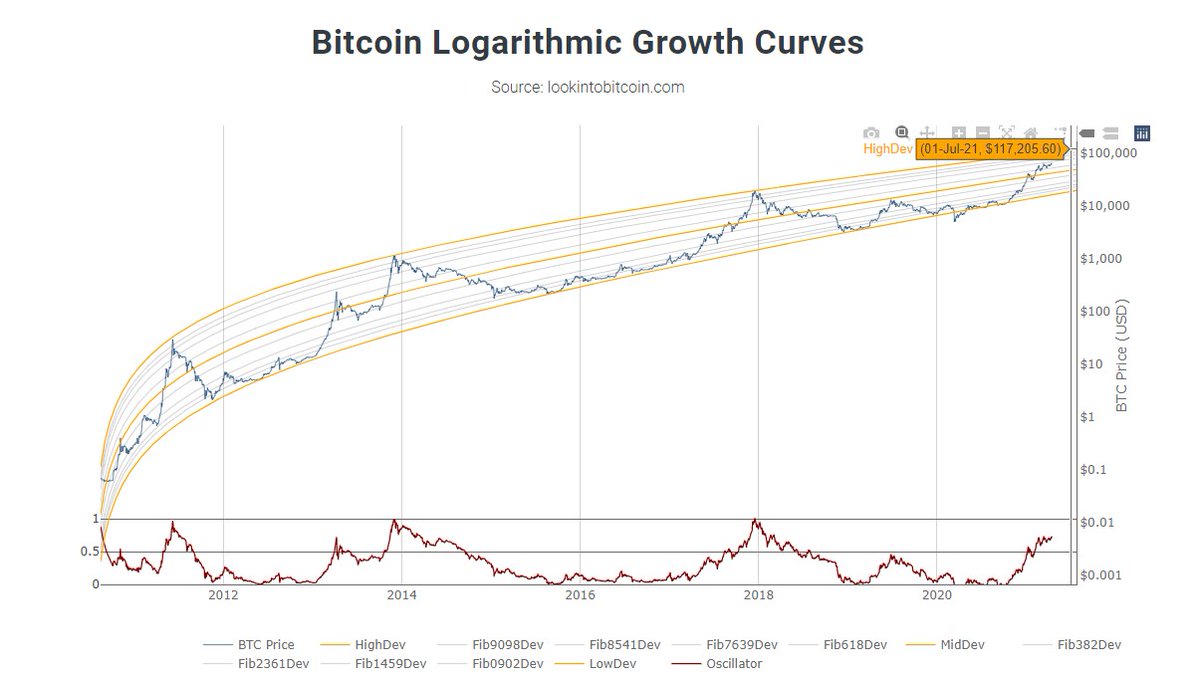
In my opinion, it still has a lot of room to rise in terms of price (not so much in terms of time)
3/n
As you can see, this indicator marks the cycle tops very well. However, these do not happen when it crosses the red average, but after a parabolic movement above it. At the moment it is not even above this MA.
4/n
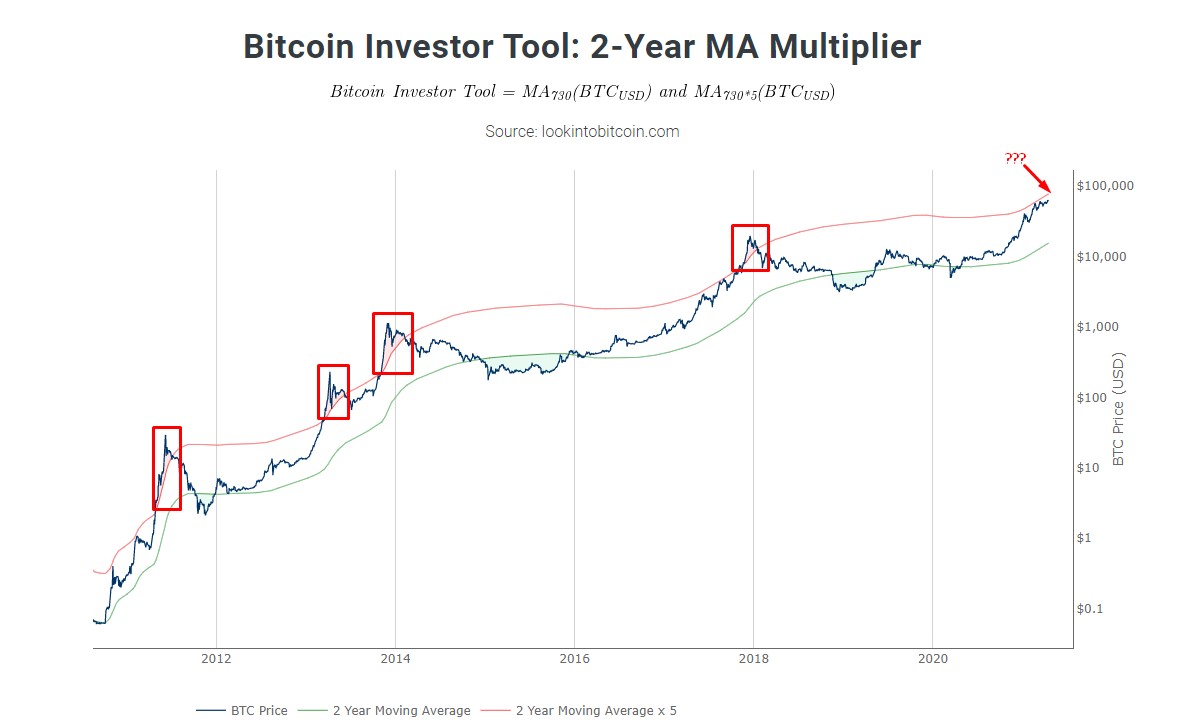
No red dots yet visible. I'd say we're halfway. An analysis cannot be based on a single indicator, but it all adds up.
5/n
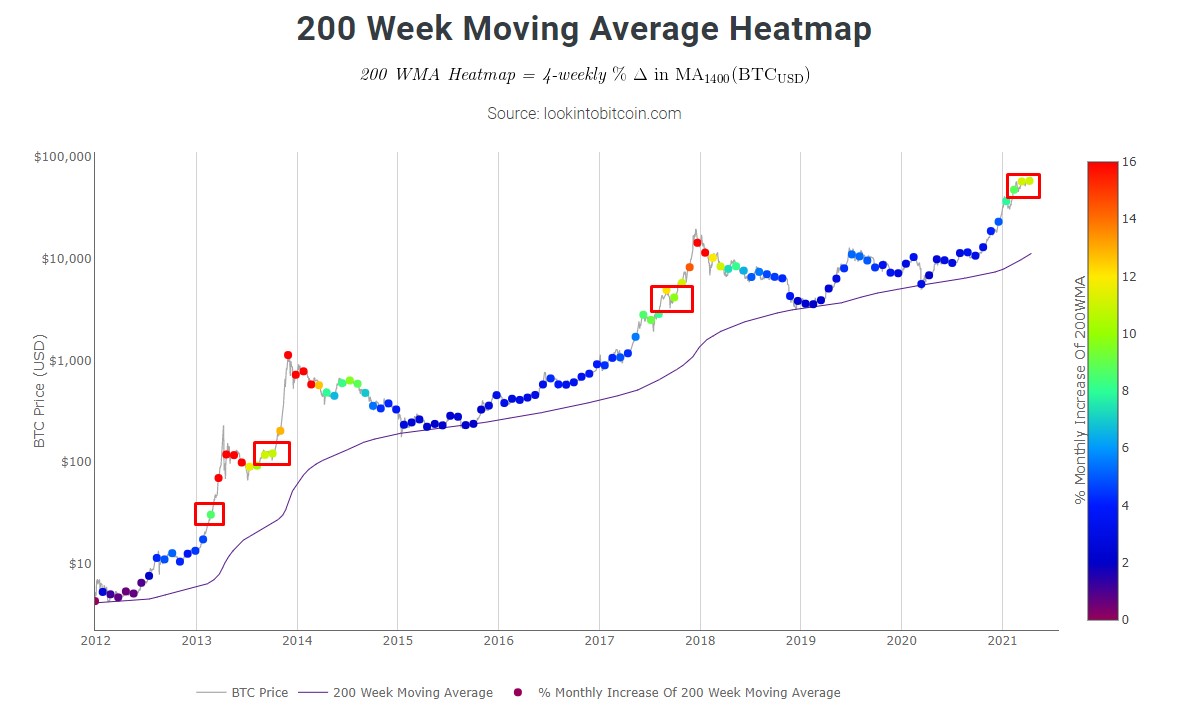
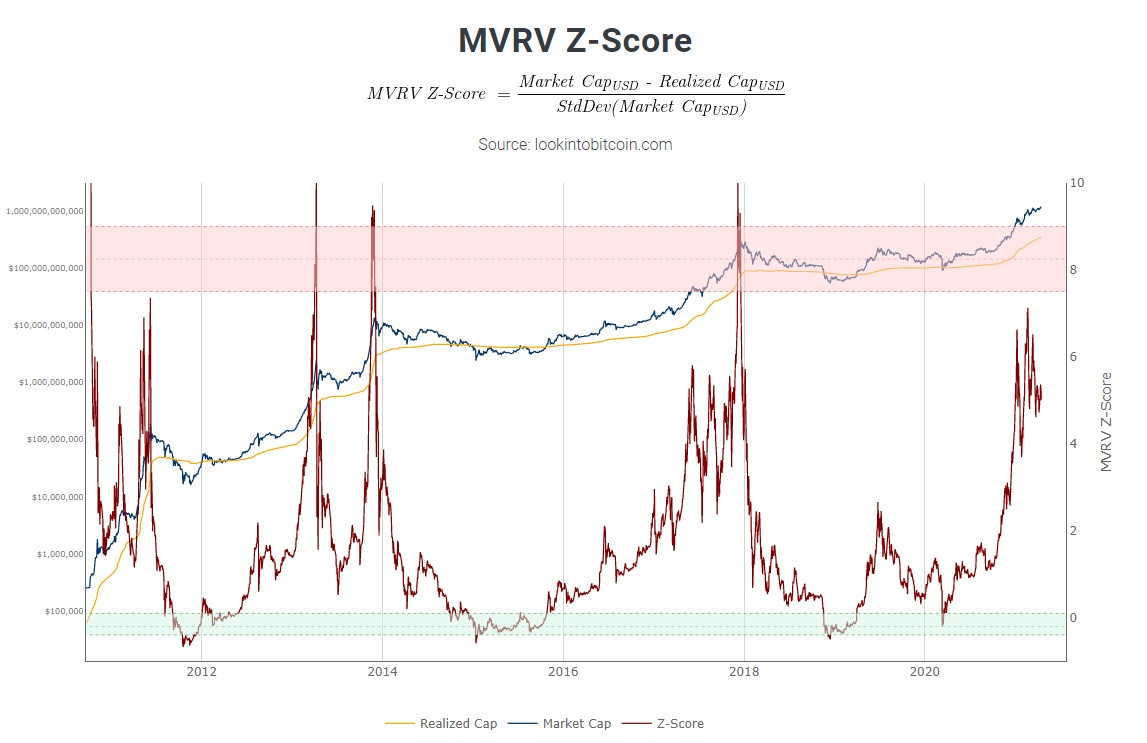
Another very good indicator to know where we are in the cycle. All cycle tops have occurred in the red zone, but as with the first indicator, they happen rather when it leaves the red zone.
6/n

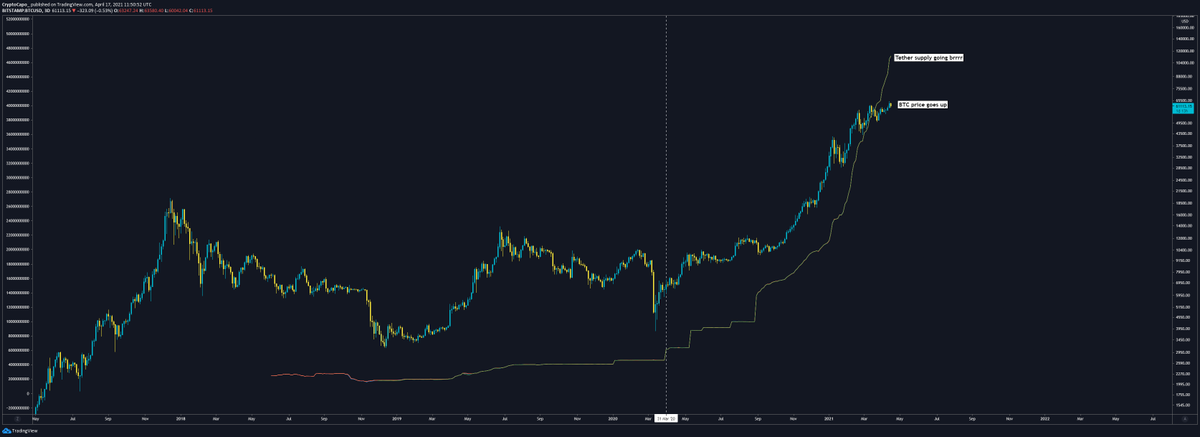
Many of you will know this model, and it is really good. Assuming a constant or increasing demand in the long term, and an increasingly reduced supply, the price tends to rise.
7/n
Sounds good, right?
8/n

Another indicator that has a margin of going up, like the previous ones. Currently the top of the logarithmic curve is above 100k, so nothing indicates that the top will be now.
9/n
I really like this one. Similar to the Puell Multiple, cycle tops usually happens when it crosses the red zone. Not there yet!
10/n
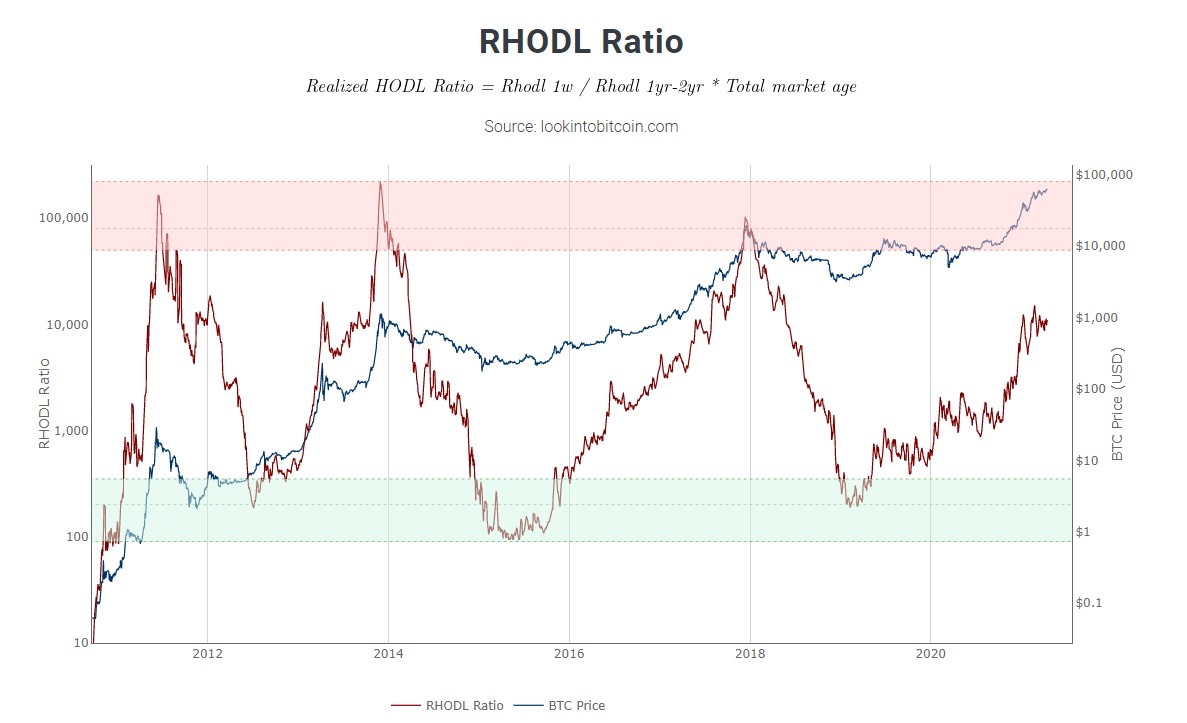
This is an awesome indicator. It marks both bottoms and tops perfectly. As you can see, it can also go higher.
11/n
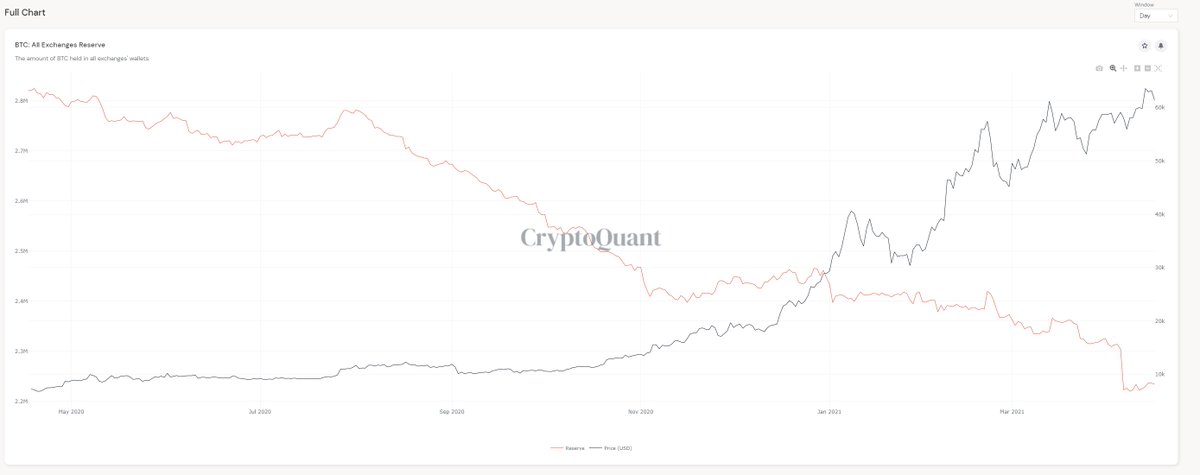
When Bitcoin reserves in exchanges wallets drop, the price tends to increase. This can mean that strong hands are accumulating, which is confirmed in the following tweet (outflows)
12/n
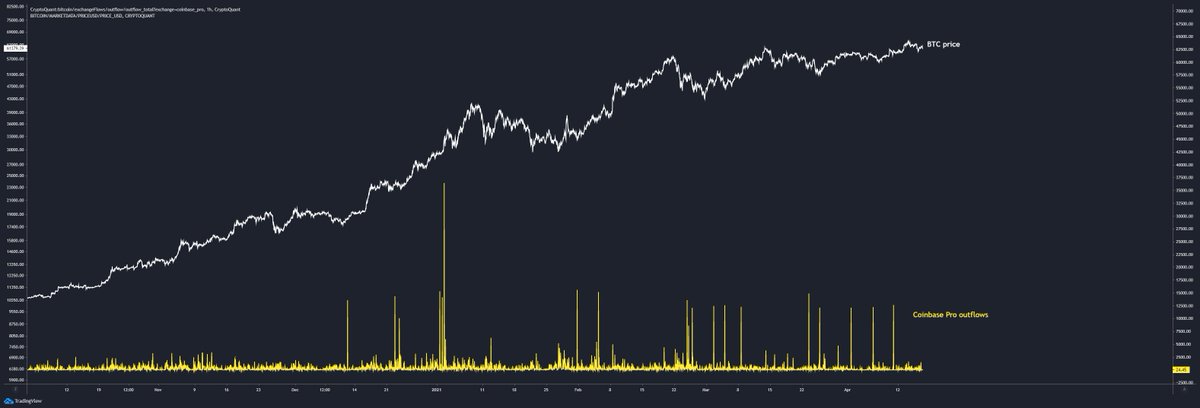
Whenever there have been big outflows on this exchange, the price has had big pumps in the following days.
These outflows are usually followed by news such as MicroStrategy, Grayscale or Tesla buying $BTC (OTC deals) The amounts match.
13/n
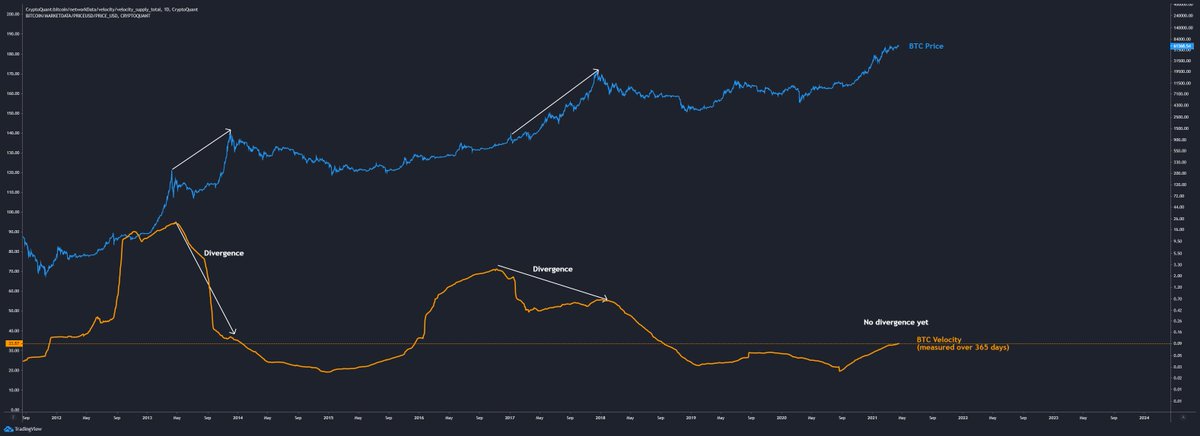
Each top is usually marked by a divergence of this indicator with the price. There is no divergence yet.
14/n
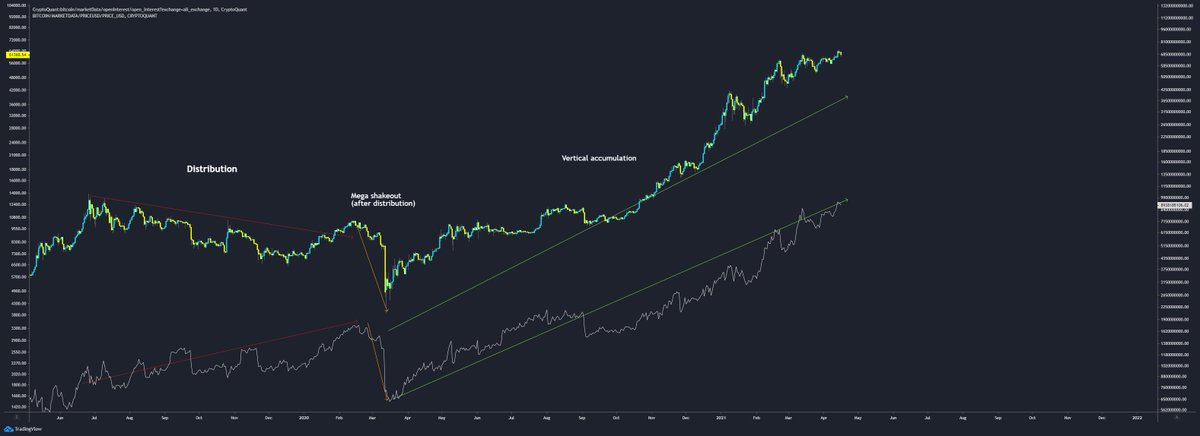
It shows that we are in a very strong trend. Open interest going up and price going up, and during the shakeouts OI goes down. This is a very healthy trend, and I don't see any signs of weakness yet.
15/n
I read many people saying that funding is high, not only in Bitcoin, but also in altcoins. This is relative.
16/n
17/n

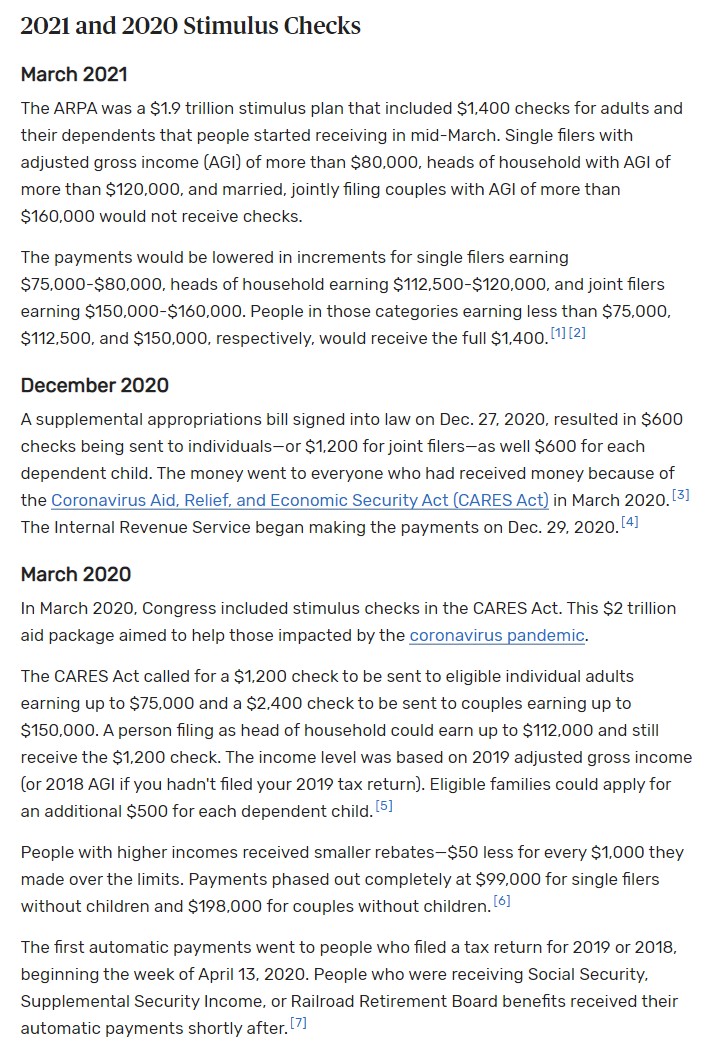
First Covid Stimulus had a big impact on the market. In fact, it marked the beginning of this bull cycle. After that, two new Stimulus have taken place.
18/n
19/n
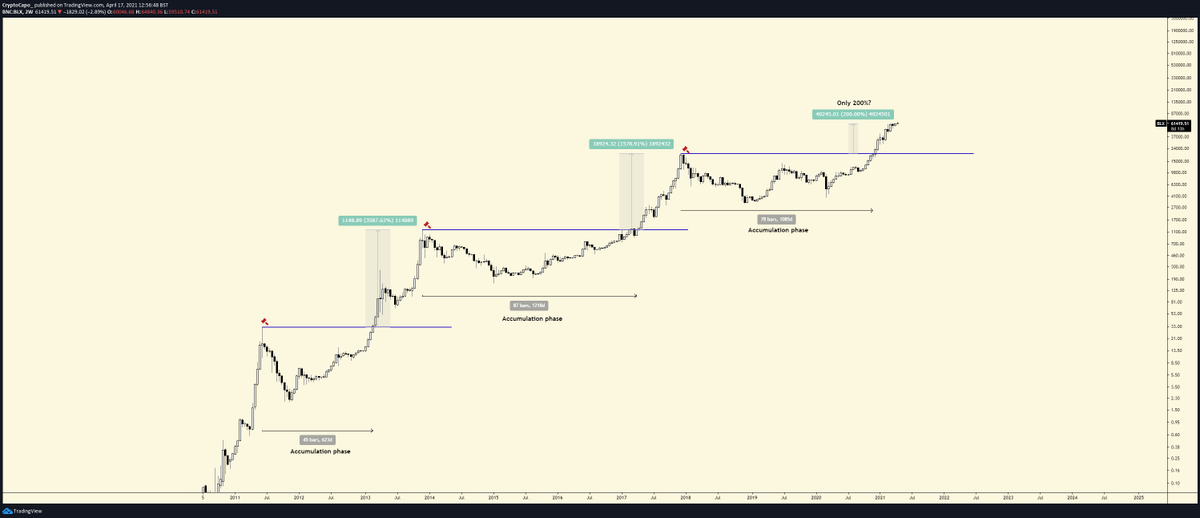
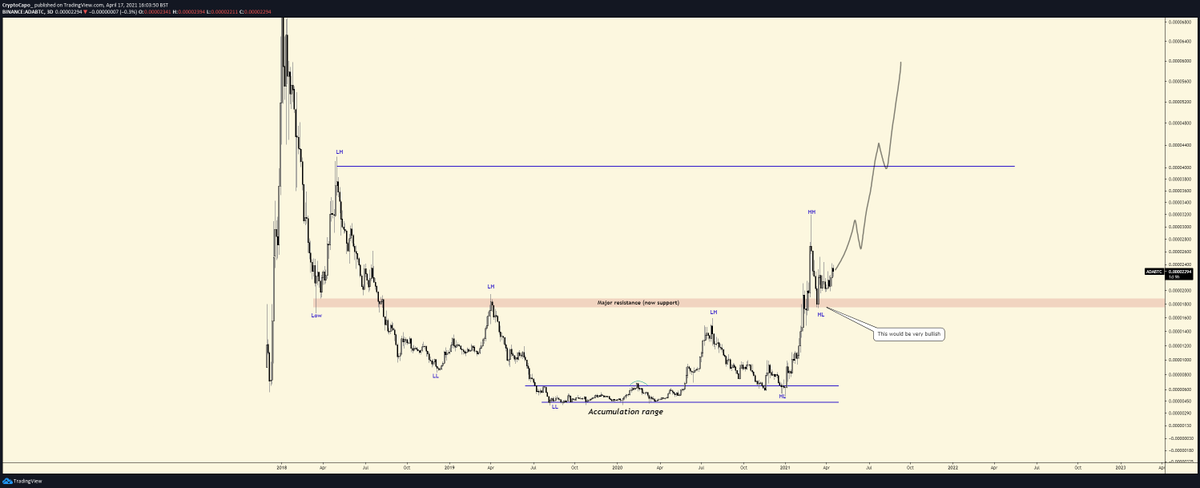
Bitcoin has broken out of an accumulation range of over 1000 days. This usually results in long extensions.
Currently, the increase over the previous ATH is only 200%.
20/n
https://t.co/odD5h45wsL
21/n
$BTC - Monthly RSI
— il Capo Of $NOIA (@CryptoCapo_) December 29, 2020
Monthly candle is about to close above 80. When this happens, bullish trend continues, with an avg. return of 1010.87%.
Each cycle is shorter. pic.twitter.com/r28DHG2SeU
Let's summarize why I think many altcoins will continue to outperform BTC.
22/n
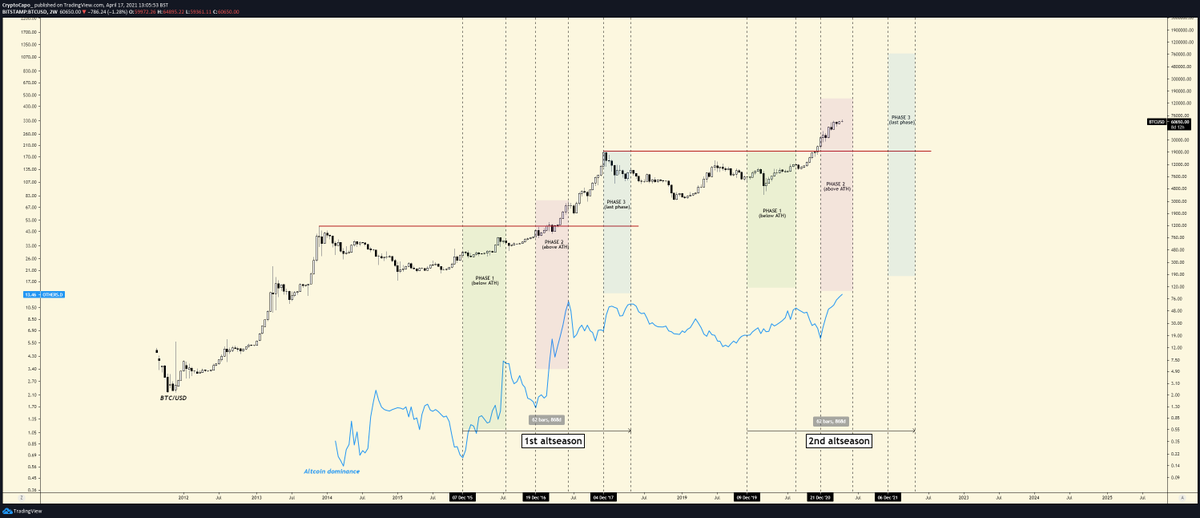
A few months ago I made this schematic, which shows very well how an altseason is developed. This is dynamic and it may not quite fit reality, but it gives us a clear vision.
We are currently in phase 2 of the second altseason.
23/n
At this level the second phase could end, and there would be a bounce of the dominance. Consolidation below = third phase
24/n

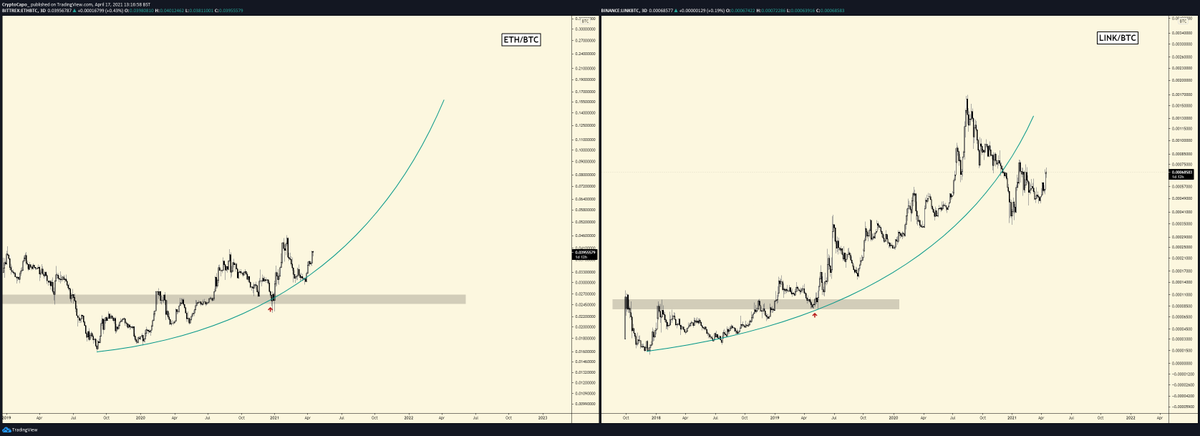
0.10 is inevitable, and a new ATH is very likely. With a new ATH, we could see ETH above BTC in the ranking for a few days.
26/n
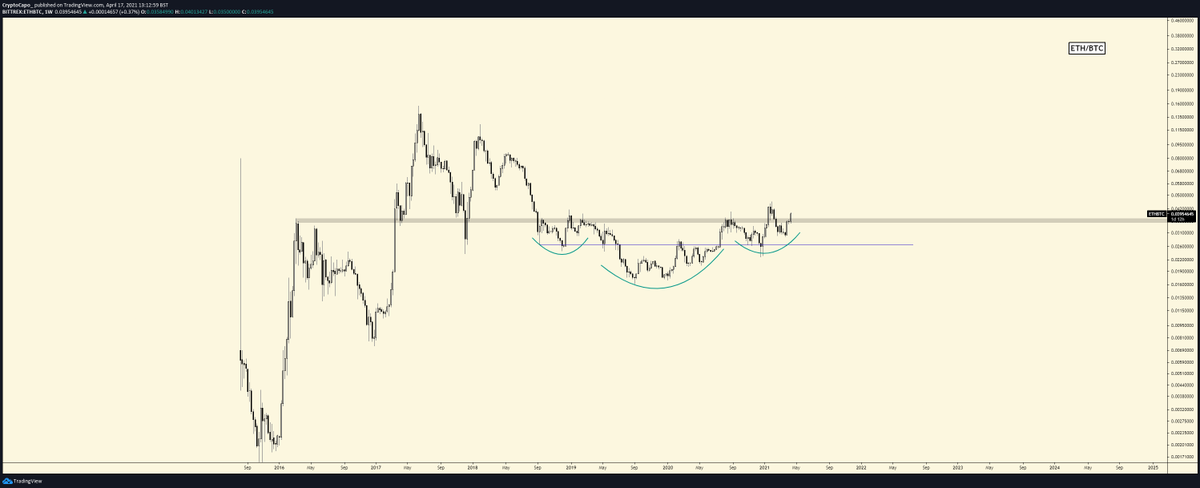
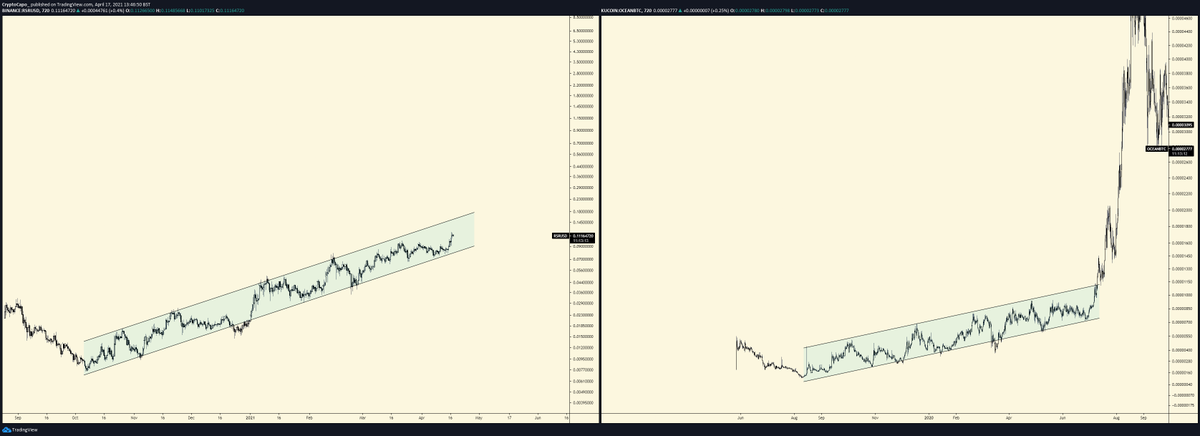
These two trends are very similar and I would not be surprised if Ethereum repeats the cycle of LINK against Bitcoin.
27/n
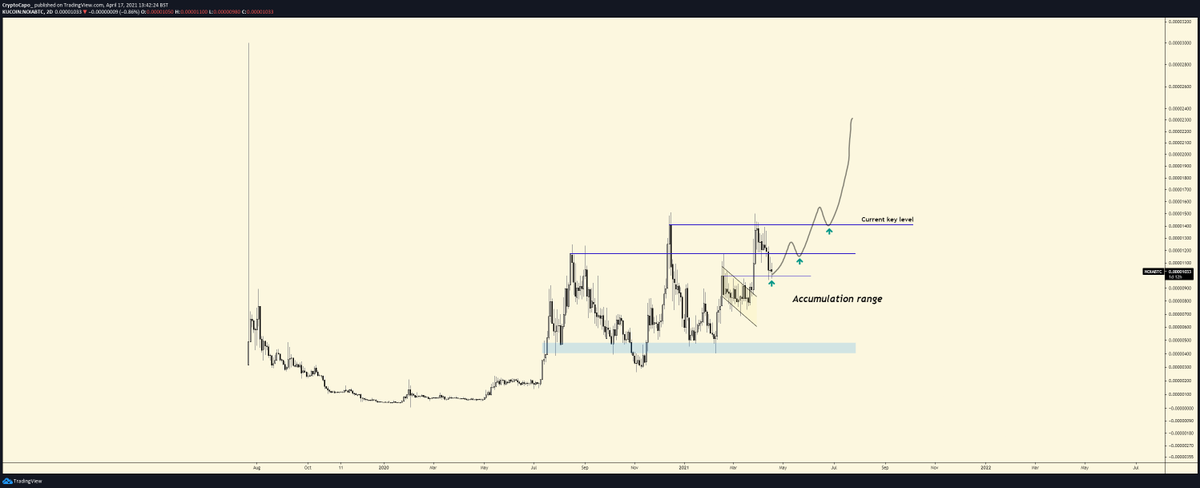
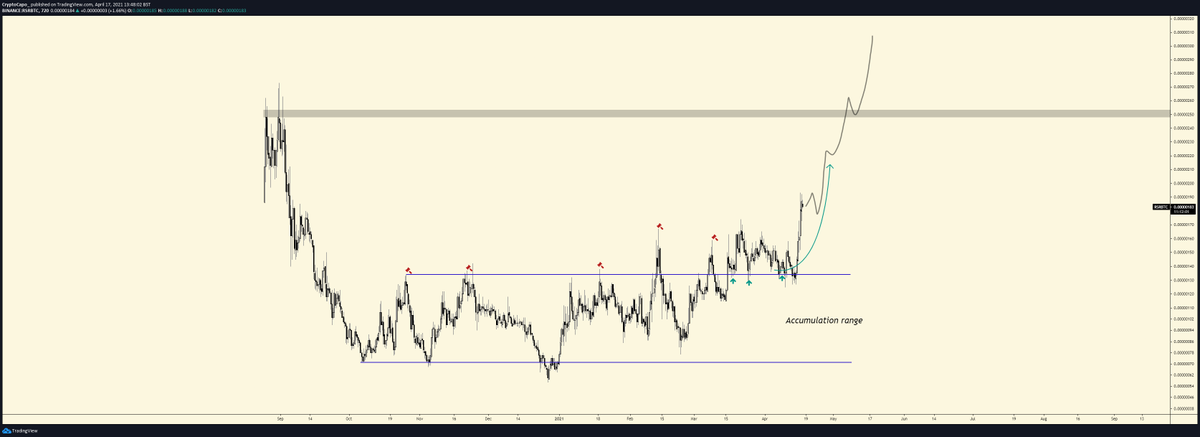
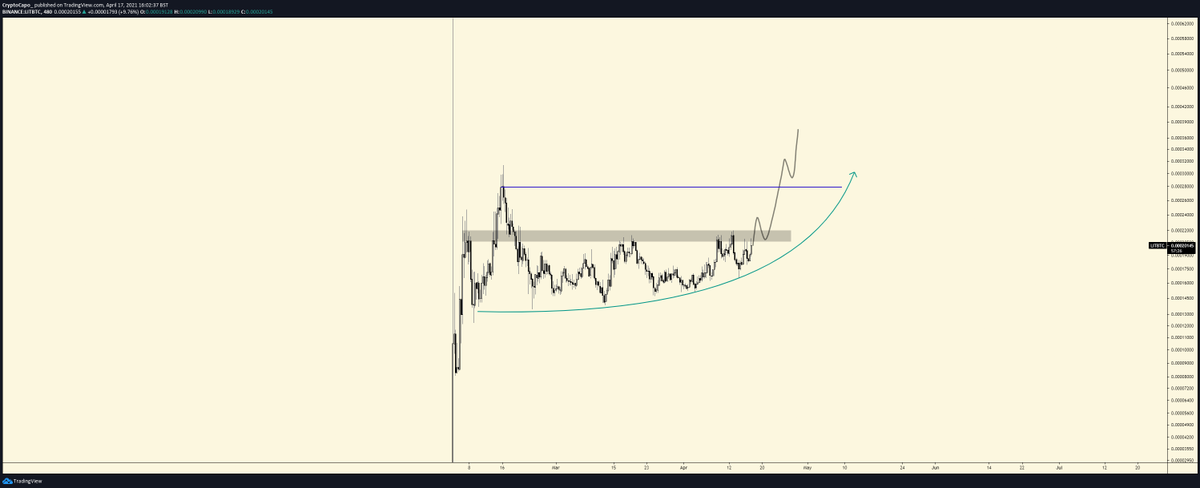
The most bullish chart you'll probably see these days.
After that accumulation range, extension could be huge.
28/n

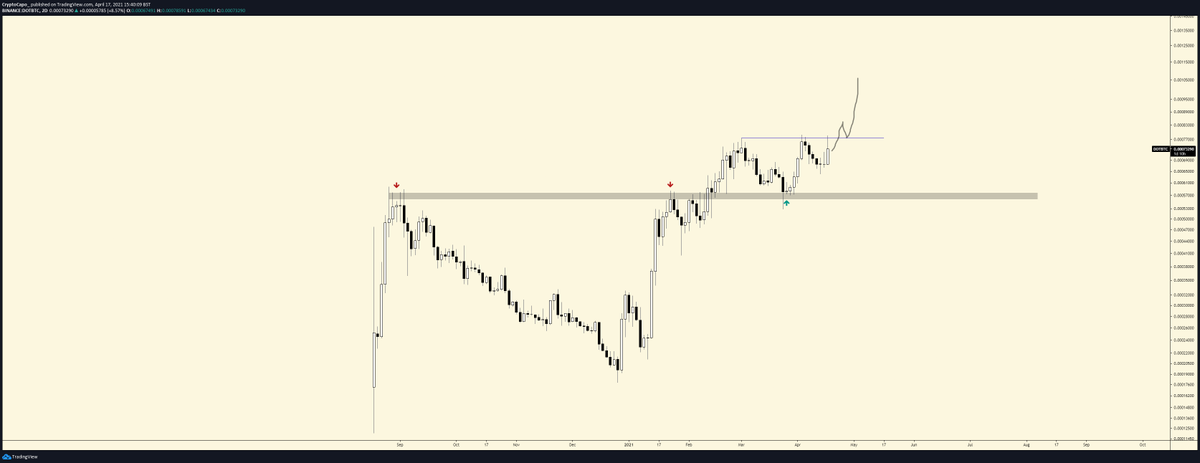
It's confirming the break of the range high, which is very good for altcoins.
https://t.co/5RJ8fb8M36
29/n
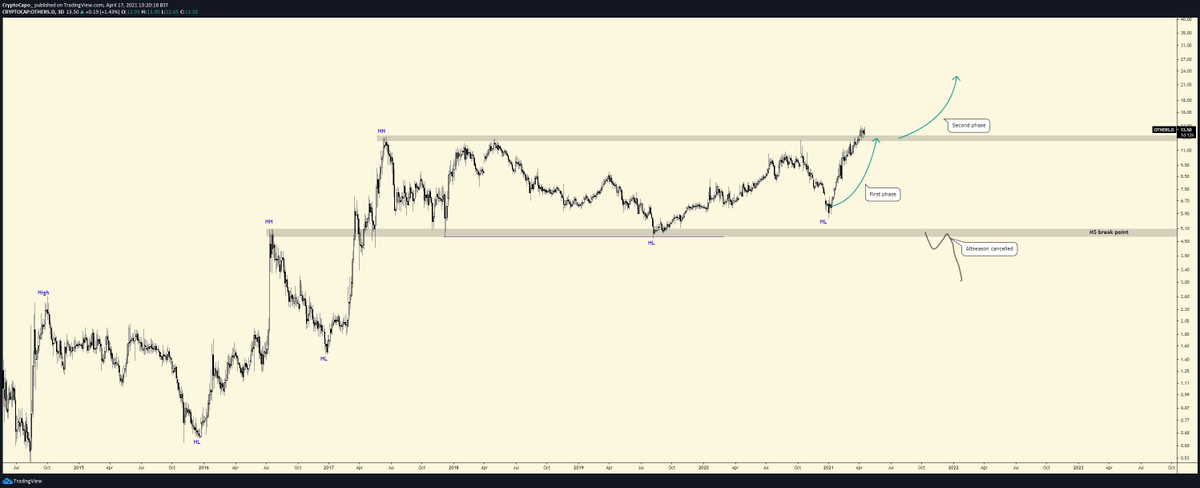
#OTHERS dominance has been on a bullish trend since 2014, but it's consolidating since mid 2017.
— il Capo Of $NOIA (@CryptoCapo_) December 28, 2020
Break below 4.75% level = altseason cancelled
Move up to 12.50% level = altseason
Consolidation above 12.50% = the mother of all altseasons pic.twitter.com/Aop7HQTGfw
This chart keeps looking very bullish to me.
https://t.co/dMXGGAB54o
30/n

#DEFIPERP
— il Capo Of $NOIA (@CryptoCapo_) December 28, 2020
Bottom for DeFi index was called here. Now, it's confirming the bullish reversal. Ready to take off.https://t.co/3ZZAeyGLlO pic.twitter.com/VOomh0KN8X
31/n
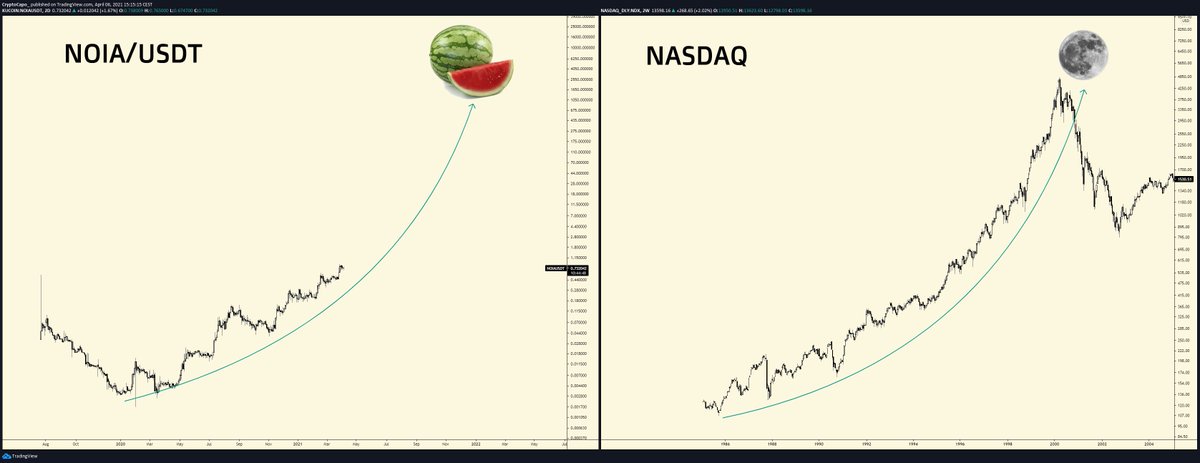
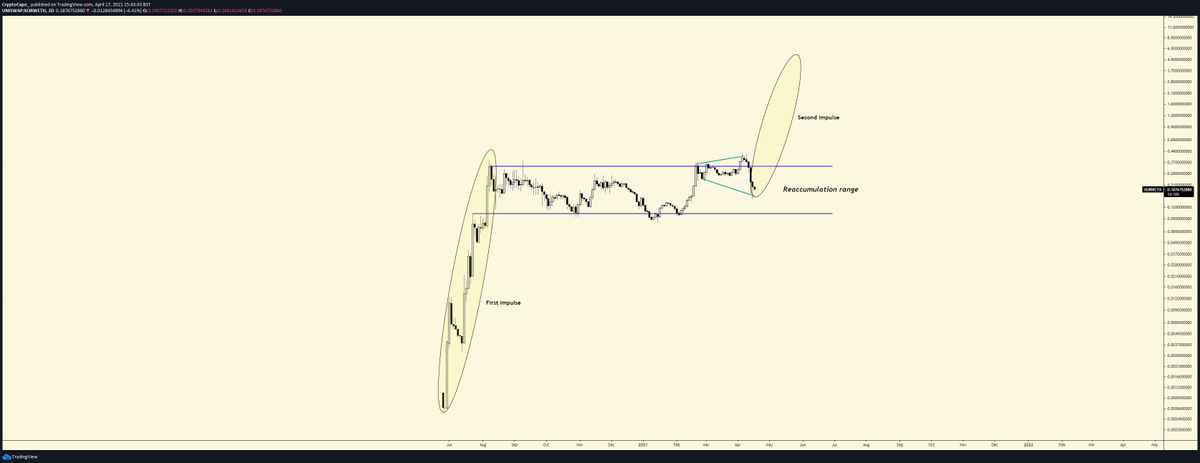
As some of you know, this is one of my favourite projects.
Chart against USD is a perfect bullish trend. Not even a single sign of weakness. How long can this trend last? Only time will tell, but it will probably be epic.
$10-20 by EOY wouldn't be crazy
32/n
Another very bullish altcoin. Solid trend as the previous one, with strong fundamentals.
Targeting $1+ this year
34/n
A S/R flip for the books. #Polkadot will keep performing very good imo, and it will be one of the majors with better perfomance in the coming months.
36/n
This one will caught many people by surprise. Bullish on the entire #Sora Ecosystem ( $PSWAP, $VAL)
37/n
Ascending triangle in one of the best projects being built in the Polkadot ecosystem.
38/n

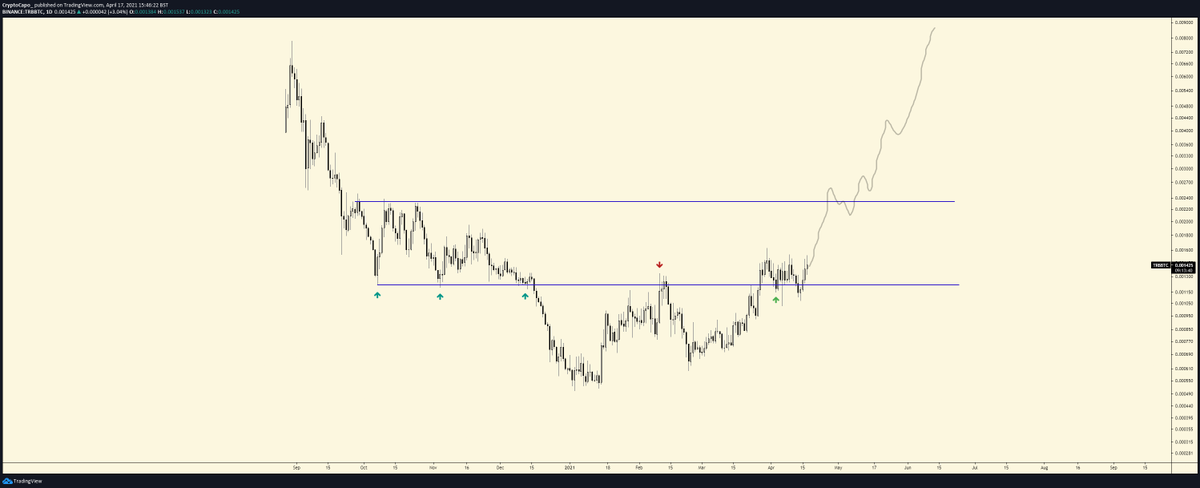
Bearish trend broken, re-entering the value zone with strength. A new uptrend is forming.
39/n
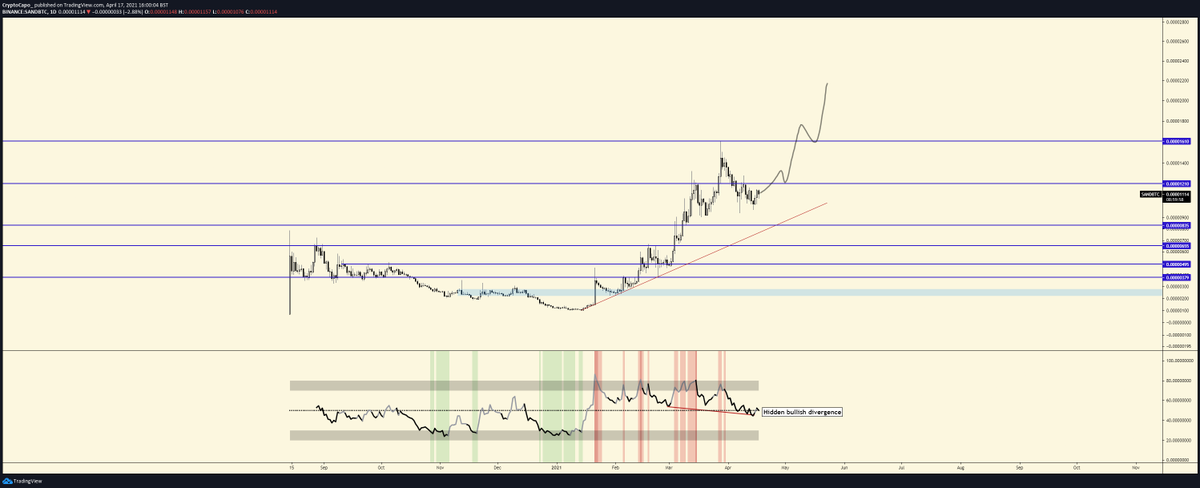
Hidden bullsih divergence formed on higher timeframes. One of my favourite NFT projects.
41/n
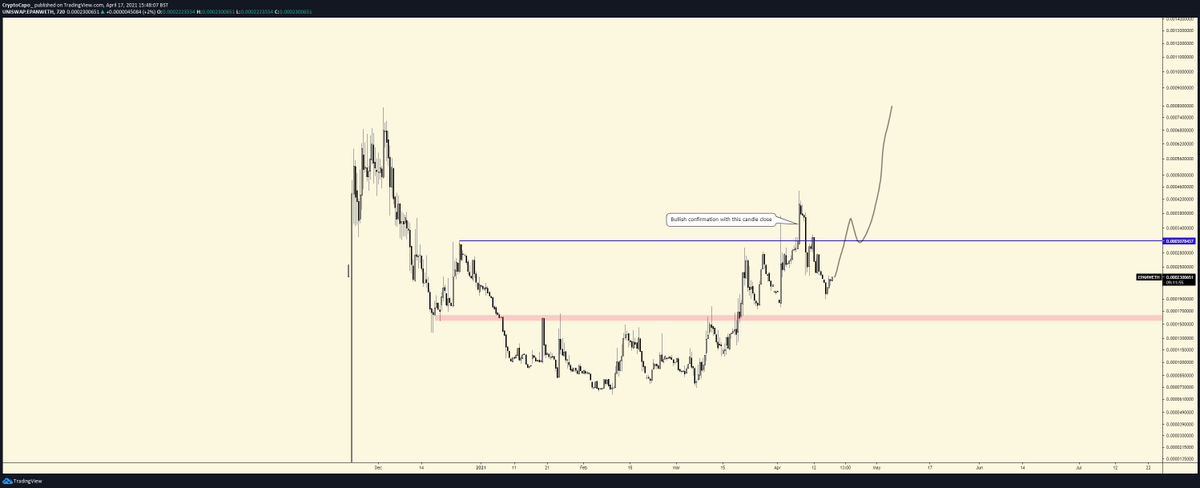
Waiting for a reclaim of the range high. Project is very good so it should do it soon.
42/n
Bitcoin bullish and alts/btc bullish = altseason
Right?
44/n
-@tradingview
-@cryptoquant_com
https://t.co/5TRVGWKg4v
Disclaimer: nothing posted here is a financial advice. Always do your own research before investing.
45/n
With all this, and some things that although I want to explain, they cannot be explained because they are intrinsic in the mind of an analyst, I can say that the best is yet to come.
46/n
When there are REAL bearish signs, I will start DCAing out.
47/n
More from All


Took me 5 years to get the best Chartink scanners for Stock Market, but you’ll get it in 5 mminutes here ⏰
Do Share the above tweet 👆
These are going to be very simple yet effective pure price action based scanners, no fancy indicators nothing - hope you liked it.
https://t.co/JU0MJIbpRV
52 Week High
One of the classic scanners very you will get strong stocks to Bet on.
https://t.co/V69th0jwBr
Hourly Breakout
This scanner will give you short term bet breakouts like hourly or 2Hr breakout
Volume shocker
Volume spurt in a stock with massive X times


You May Also Like


✨📱 iOS 12.1 📱✨
🗓 Release date: October 30, 2018
📝 New Emojis: 158
https://t.co/bx8XjhiCiB
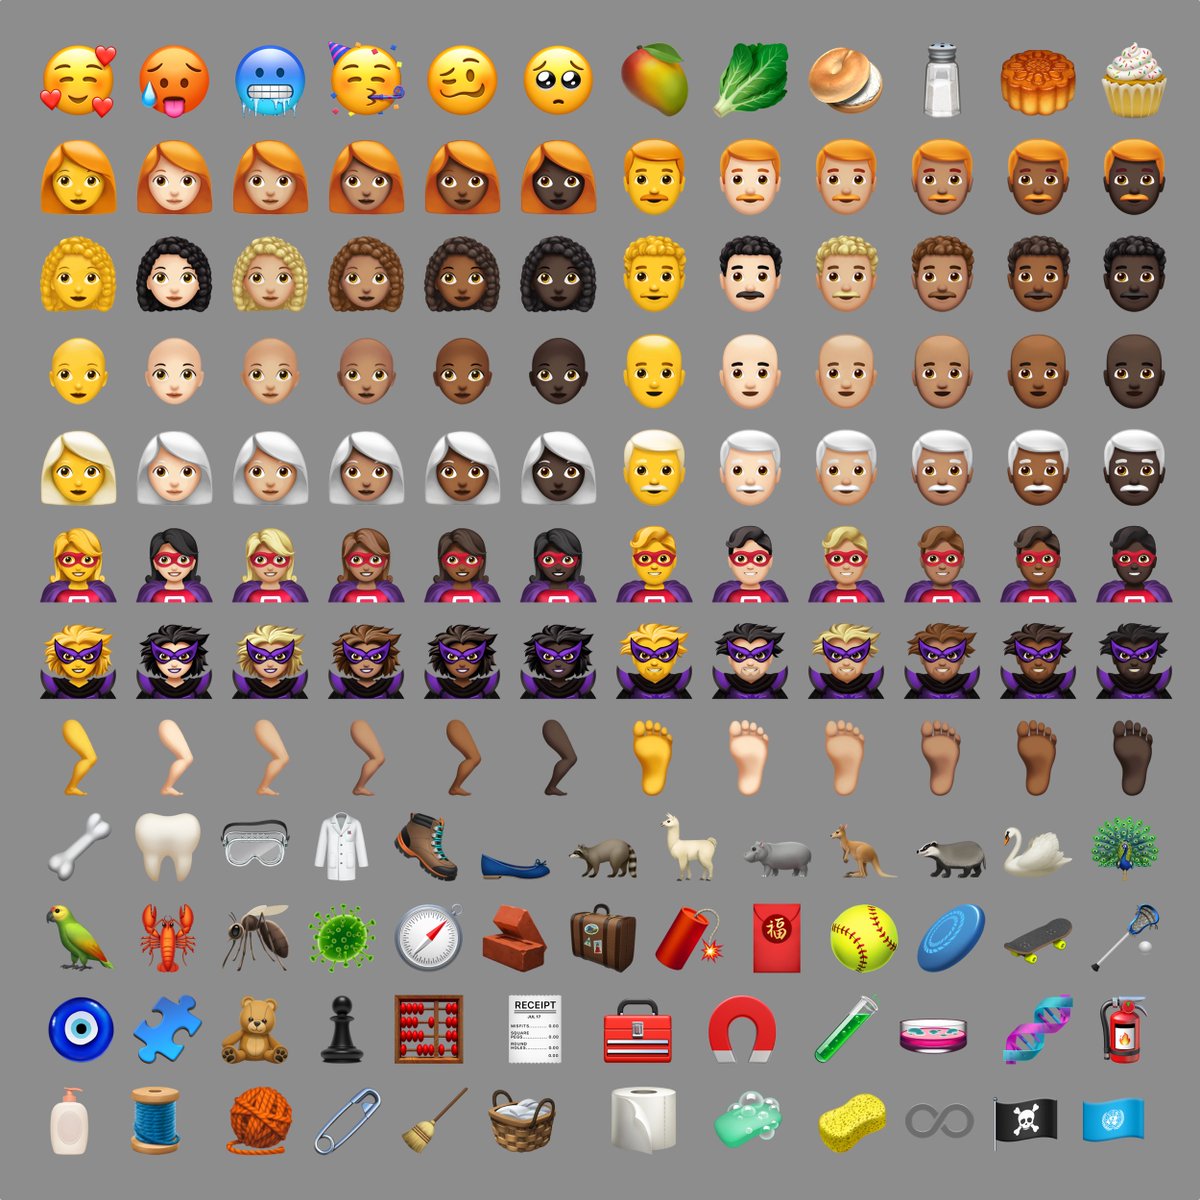
New in iOS 12.1: 🥰 Smiling Face With 3 Hearts https://t.co/6eajdvueip

New in iOS 12.1: 🥵 Hot Face https://t.co/jhTv1elltB

New in iOS 12.1: 🥶 Cold Face https://t.co/EIjyl6yZrF

New in iOS 12.1: 🥳 Partying Face https://t.co/p8FDNEQ3LJ

🗓 Release date: October 30, 2018
📝 New Emojis: 158
https://t.co/bx8XjhiCiB
New in iOS 12.1: 🥰 Smiling Face With 3 Hearts https://t.co/6eajdvueip
New in iOS 12.1: 🥵 Hot Face https://t.co/jhTv1elltB
New in iOS 12.1: 🥶 Cold Face https://t.co/EIjyl6yZrF
New in iOS 12.1: 🥳 Partying Face https://t.co/p8FDNEQ3LJ