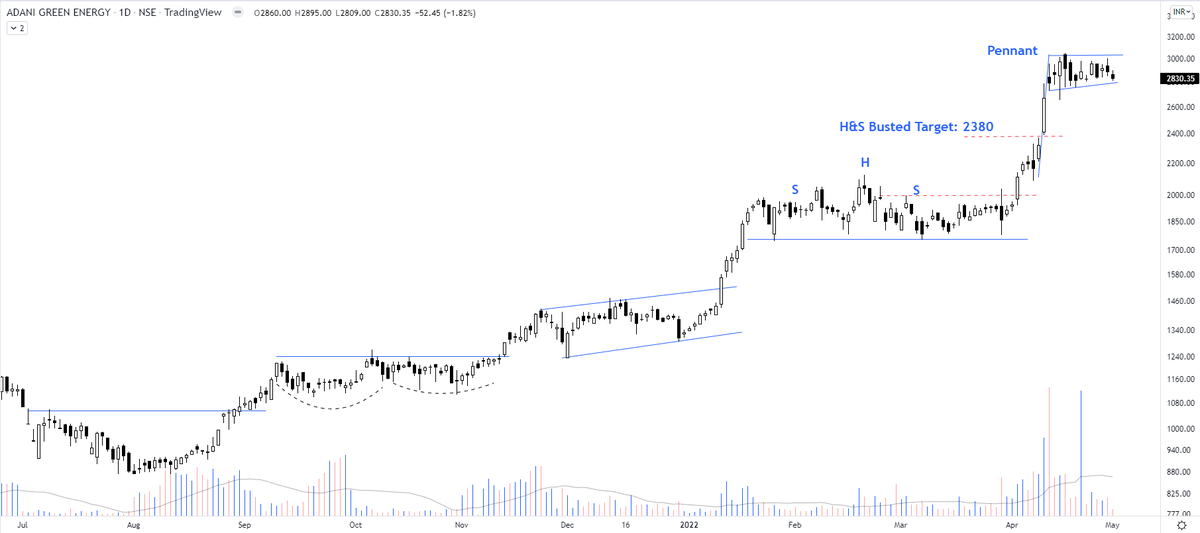
Will be looking for pennant continuation move post 3050 in the case of Adani Green.
No trigger yet. The chart is still strong
More from The_Chartist 📈
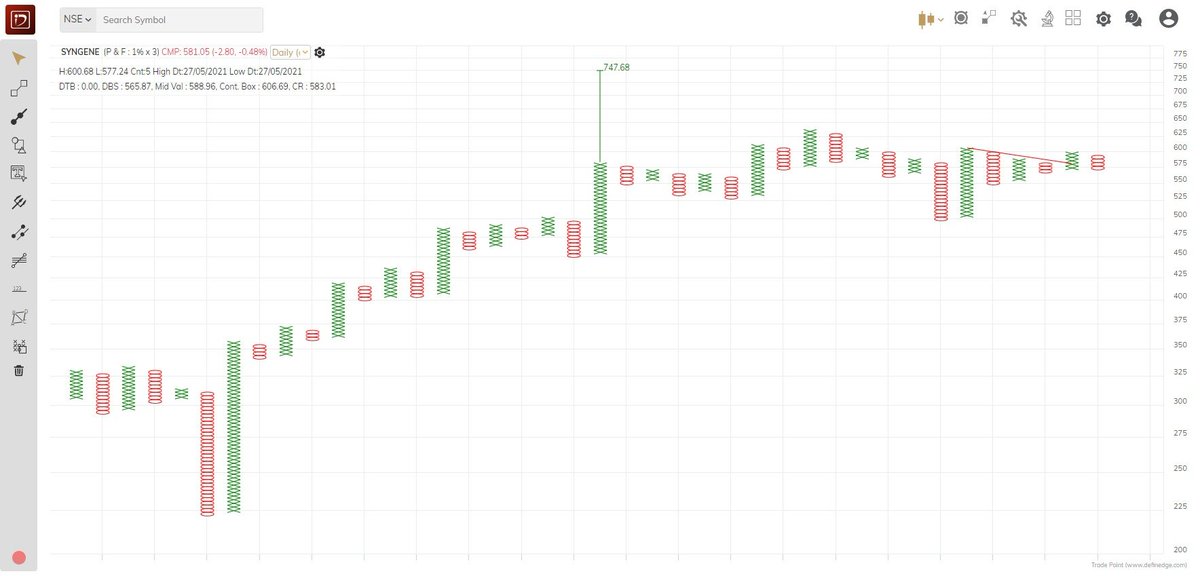
Syngene - Same concept. Price contraction. Shift from weak to strong hands through repeated volatility contractions. I can well write one whole page explanation on it. Look at the volume pump today. A big hand will never let you ride with him. Make sure you are there at the party https://t.co/RN8sQYzdBg pic.twitter.com/AShKWnQeJt
— Steve Nison (@nison_steve) July 15, 2021
A bullish flag pattern right after the breakout. Although the broader rectangle target of 1190 is way more than this bullish flag target https://t.co/wdAzb7SS7L
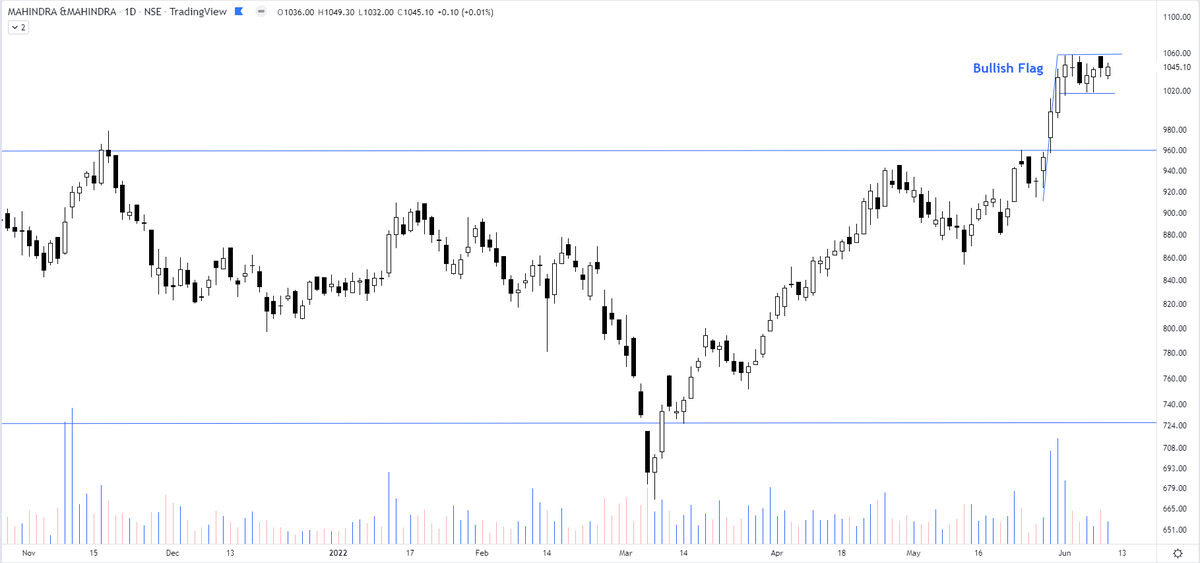
Interesting chart of Mahindra & Mahindra consolidating in a rectangle pattern & the price not falling back to the lower support. pic.twitter.com/GJ7rCfkB9f
— The_Chartist \U0001f4c8 (@charts_zone) May 26, 2022
Nifty Private Bank https://t.co/BwG1DKhhLc
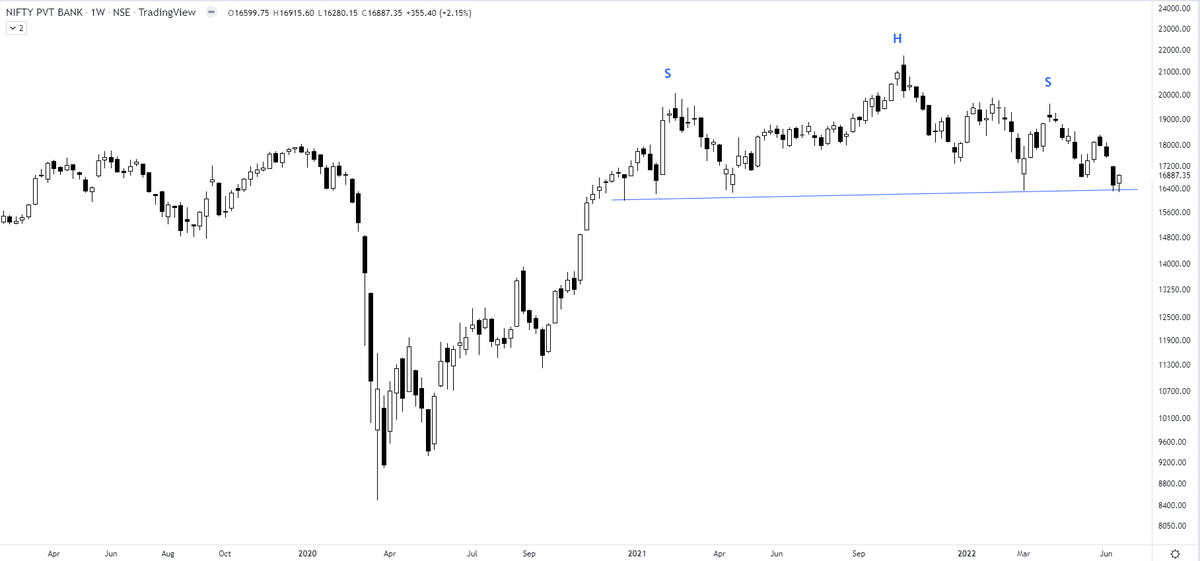
I am watching a big bearish H&S top building up in Nifty Private Bank Index. Any breakdown will result in increased volatility in respective charts. For traders - definitely not a spot to be in. The index has to move beyond 19900 to negate the pattern. pic.twitter.com/IGFeyNrtQV
— The_Chartist \U0001f4c8 (@charts_zone) June 19, 2022
You May Also Like

Here I will share what I believe are essentials for anybody who is interested in stock markets and the resources to learn them, its from my experience and by no means exhaustive..
First the very basic : The Dow theory, Everybody must have basic understanding of it and must learn to observe High Highs, Higher Lows, Lower Highs and Lowers lows on charts and their
Even those who are more inclined towards fundamental side can also benefit from Dow theory, as it can hint start & end of Bull/Bear runs thereby indication entry and exits.

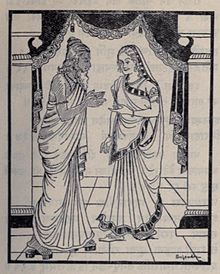
Next basic is Wyckoff's Theory. It tells how accumulation and distribution happens with regularity and how the market actually
Dow theory is old but
Old is Gold....
— Professor (@DillikiBiili) January 23, 2020
this Bharti Airtel chart is a true copy of the Wyckoff Pattern propounded in 1931....... pic.twitter.com/tQ1PNebq7d