Authors Jainish Lamoria
7 days
30 days
All time
Recent
Popular

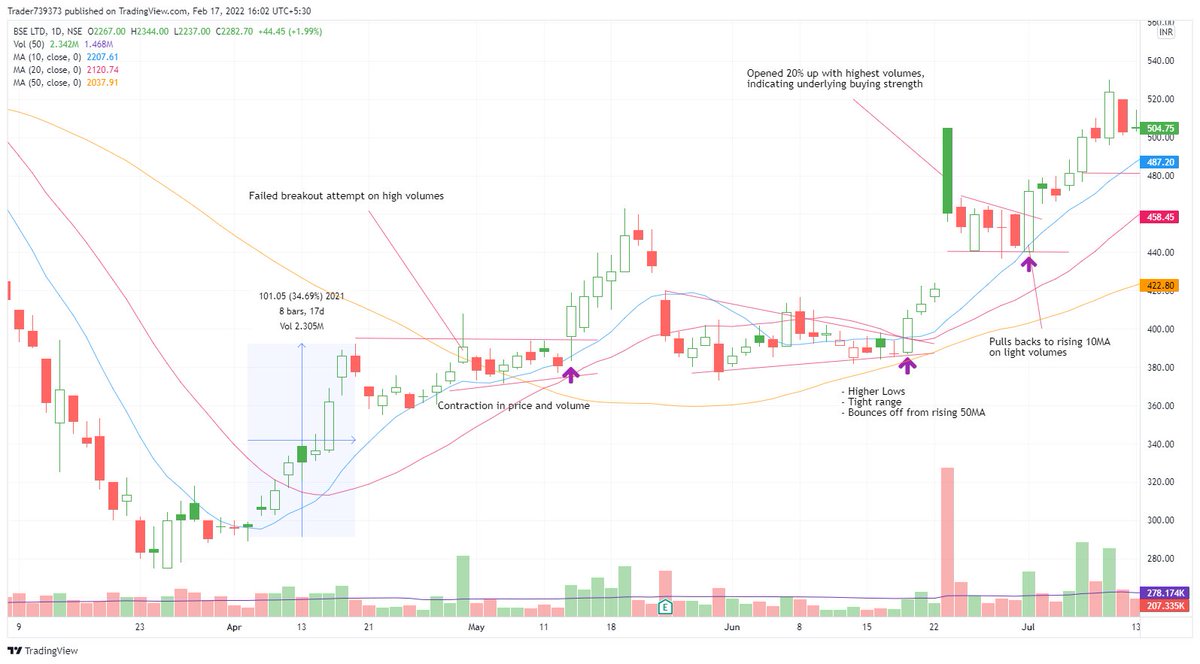
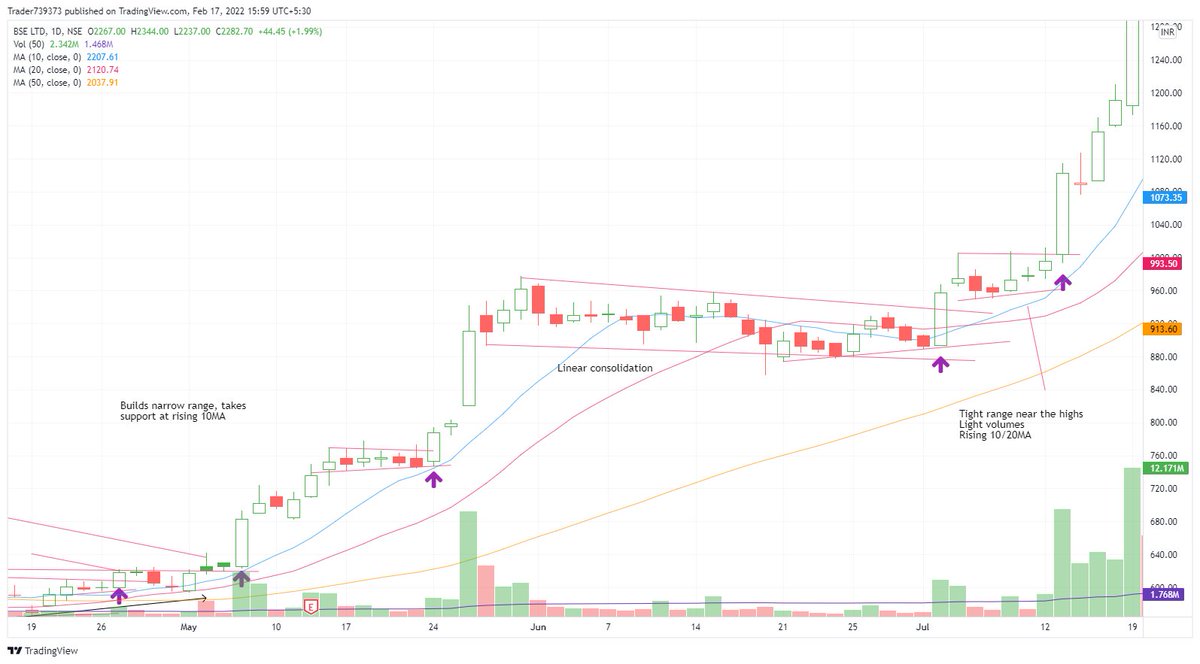
Study big movers, notice price action and if you can boil water, then you'll find many similarities and be able to develop 3-4 setups, pick any one of them and master it.
An example: #BSE
(1/n)
...cont
#BSE
You don't need to catch bottoms and identify tops or follow news or scout for stock tips in order to make consistent money.
(2/n)
Another Example: #TATAMOTORS
Another Example: #LAURUSLABS
An example: #BSE
(1/n)
...cont
#BSE
You don't need to catch bottoms and identify tops or follow news or scout for stock tips in order to make consistent money.
(2/n)
Another Example: #TATAMOTORS
One of the best ways to build your own system is to study big winners.#TATAMOTORS one such example
— Jainish Lamoria (@stonkssguy) February 15, 2022
(1/n) pic.twitter.com/JopiSEu0wq
Another Example: #LAURUSLABS
#LAURUSLABS
— Jainish Lamoria (@stonkssguy) February 14, 2022
1st sign of a potential winner, makes a big move in a very short period of time (this was up 70% in 25 days)
Big winners will have simpler setups, break the base with narrower green bars sloping higher.
1/n pic.twitter.com/hsB4gwupDD
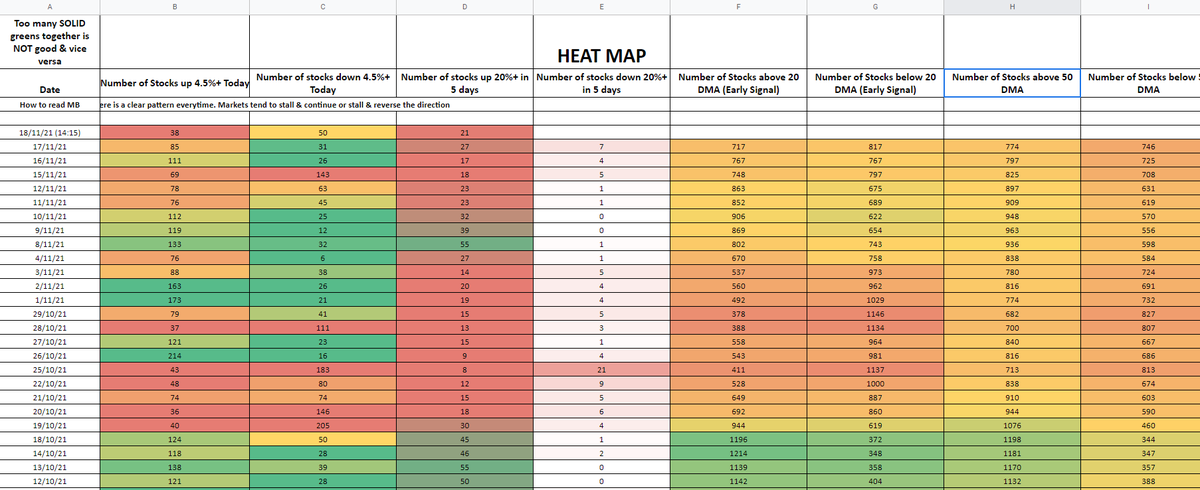
🧵Market Breadth 101
It is a broad approach to overall market analysis that helps traders to realize the underlying strength or weakness associated with a market move
Thanks @PradeepBonde for the blogpost & @iManasArora for making breadth tool in context of Indian Market
(1/n)
(2/n)
Breadth will treat all stocks in an index equally. Stock with largest capitalization and the smallest are both equal in breadth analysis. It can be applied to any exchange or index of securities, any sector or industry group.
(3/n)
One may consider it "oscillating indicator", when reached a threshold level, either positive or negative, they tend to reverse or take a halt.
It is concerned with probability that market is approaching a major turning point, so it isn't helpful knowing everyday trends.
(4/n)
Breadth is based on the price of the variables, still it can offer leading indications based upon the identification and use of previous levels or thresholds that are consistent with similar market action.
(5/n)
Breadth directly indicates/represents the market, no matter what the indices are doing.
Might look complex to understand it at sight. Let's try to break it down.
Link: https://t.co/nvEuNXoiZ7