I've been a @TrendSpider user for almost 2 years now. Time flies when you're having fun.
Here are my top features & tools from the platform I use every day when doing my technical analysis on charts.
🧵👇🏼
1/ Alerts
This is the number one feature that is critical to my work. I can't watch every single chart on the screen at all times. When I find a trade I like, the first action that happens after charting is setting an entry alert. In addition, I set alerts at my targets as well.
2/ Dynamic Watchlists
This is my starting point for my weekend work. It helps me clarify what I will be watching in the coming days. The secret sauce is the dynamic lists you can generate off of scans.
Here's a video from the @TrendSpider University
3/ Scanning
Every trader has a method & part of my core process is scanning. @TrendSpider makes it easy with pre-built scans at your fingertips. They also allow you to build your own custom scans that you can then turn into a watchlist.
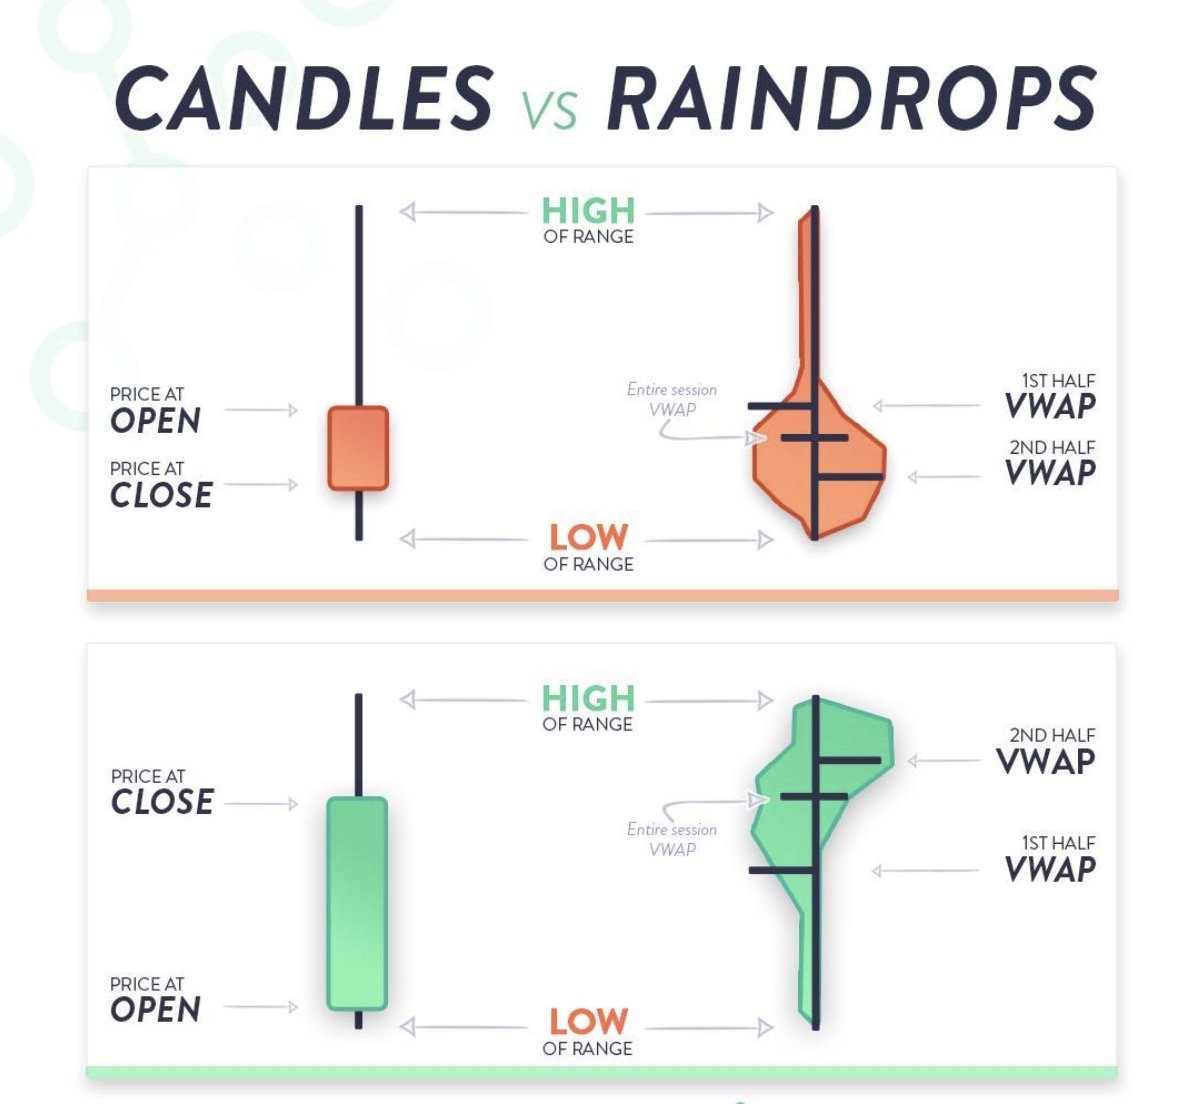
4/ Raindrops
Raindrop Charts are designed to let you see what’s happening in the market by visualizing price & volume together. Providing a clear snapshot of supply and demand.
They offer huge insight as to where other traders are buying 📈& selling 📉.
ONLY on @TrendSpider