A Mega Thread on Price Action Trading!🧵👇
#LearnWithChartmojo #stocks #trading
1/13
Have you ever felt a lack of research as a cause of losing money?
Get out of the trap by focusing on price action and following the market to make money from smart money’s research.
2/13
As suggested by the name, price action is the plot of a security’s price movement over a particular period.
Traders use this data to understand the temperament of the markets to make money trading profitably.
3/13
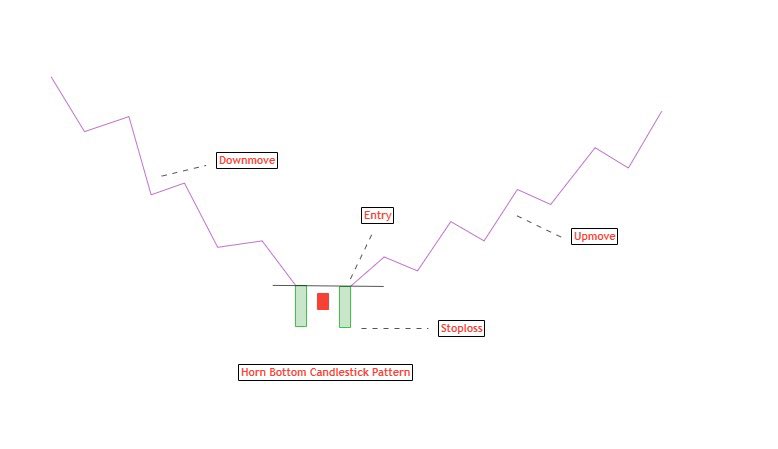
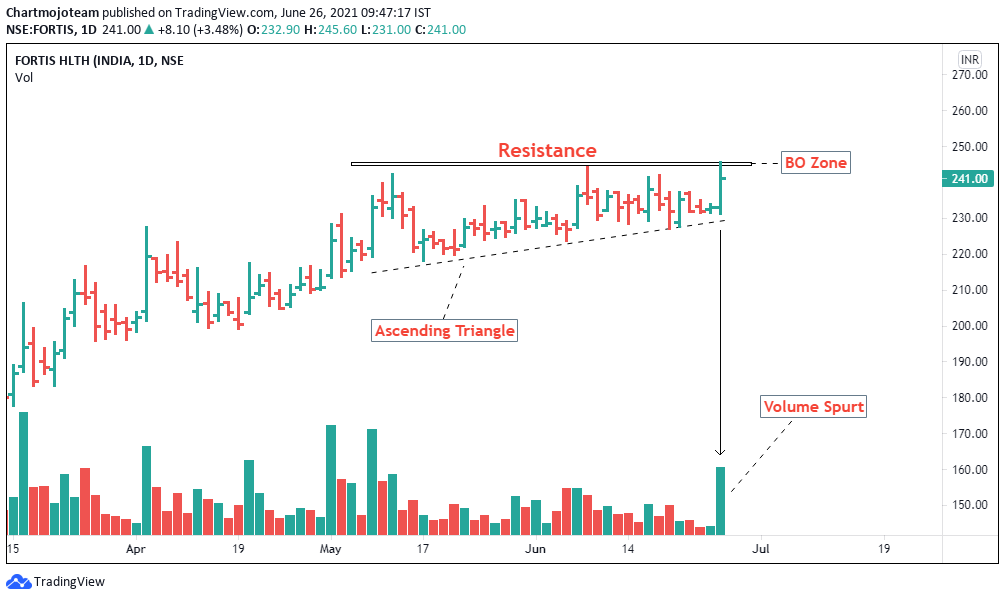
Price action trading is a widely used trading technique that relies on reading, analyzing, and interpreting the price movement of a particular security and the subsequent patterns formed due to it.
4/13
In its essence, price action trading capitalizes on the crowd mentality inherent in the markets and the consequent repetitive price behavior. It provides a psychological edge in its leading nature.