SAnngeri's Categories
SAnngeri's Authors


Latest Saves

• Creative enough to look beyond the obvious
• Covering another unique set up: Rating Houses Contra Trades or as he calls it "Moody-no-so-Moody indicator"
🧵 to learn from @iManasArora
• Usually international rating agencies come with a downgrade only after a massive correction in the stock
• Similarly these rating agencies come with an upgrade report post a sharp rise in the stock
• Don't take them on face value and DYOR!
• How Ultra Bullish articles from rating/broker houses is used to dump the stock to retail
• New traders provide liquidity for BIG players to offload their stocks
#HEG
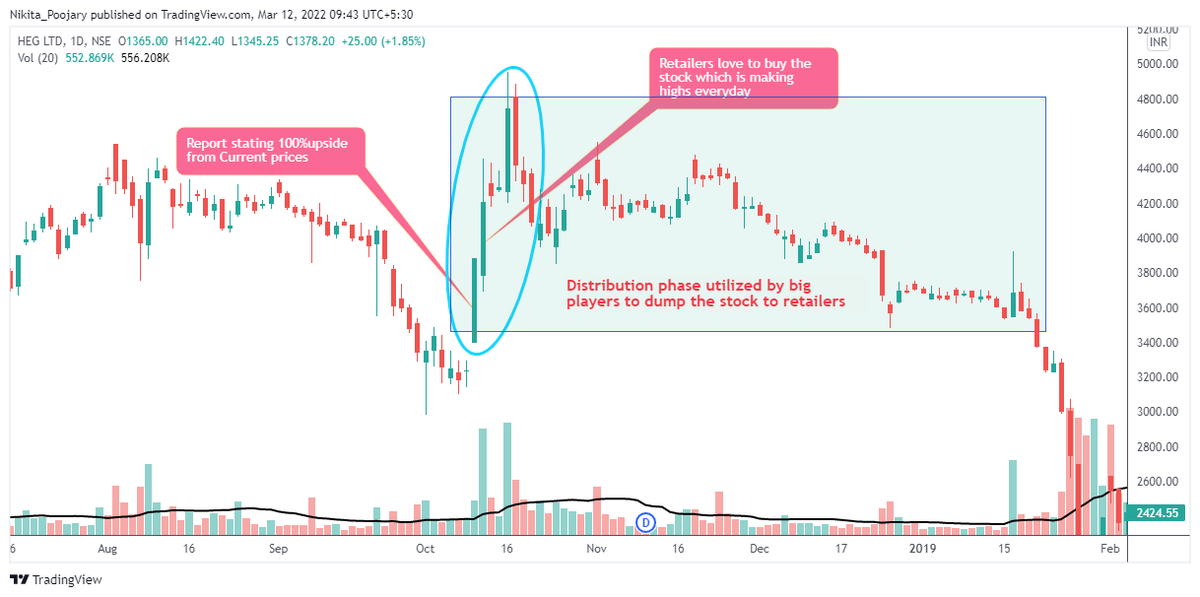
• Example 1: BofAML sees 100% rise
• Read this thread to know in detail
Next 2-4 weeks are crucial for #HEG. If it does not hold up the current level plus minus 5%, there will be an 80% chance of a 20% drop which could extend to up to 50% drop.
— Manas Arora (@iManasArora) October 19, 2018
News based rally on a low volume could turn into a classic case of late stage base fail. pic.twitter.com/eh3ncaSxoy


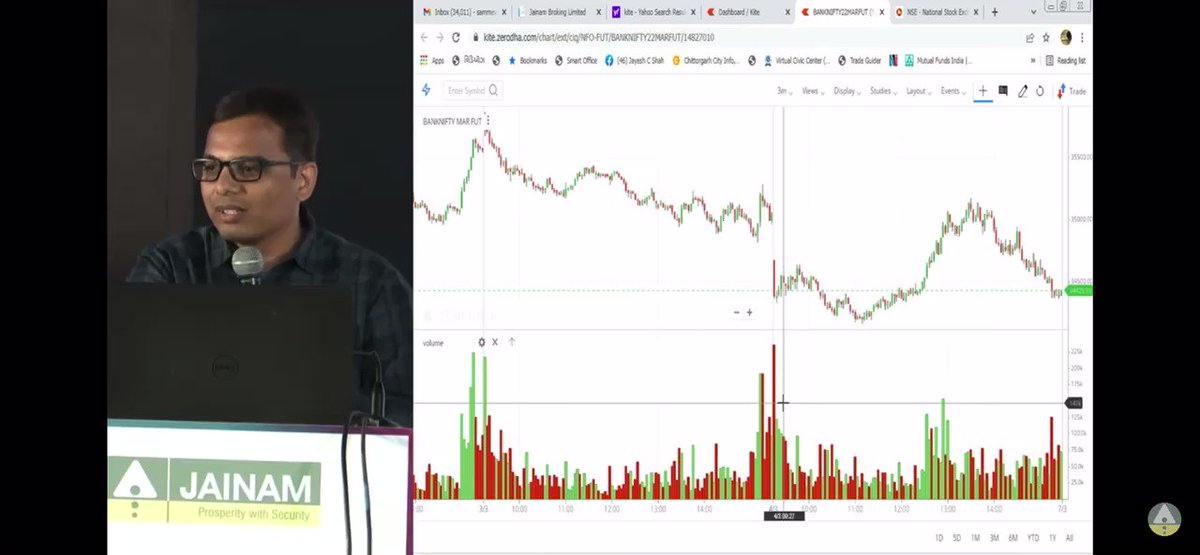
See Large OIl buildup kin strikes par hai and in between strikes data kaise move ho raha hai.
Thumb Rule:
Calls Reduction + Puts addition = Upthrust
Calls Addition + Put Reduction = Down move
Higher the Delta OI velocity, faster is the move.
For Nifty Intraday Traders: As of now, this seems to be a buy on dip market and looks like there won't be any juicy trades on short side. Will update if data changes. https://t.co/PCIyyPld4A pic.twitter.com/ES3o4z60rY
— Professor (@DillikiBiili) March 11, 2022


(I personally never trade based on O=H/ O=L; area is prone to spikes.)
But, when index & heavyweights have O=H at same time, it lends more credibility. -> today Gapup buyers were not in control.
#nifty #hdfc #infy #hdfcbank #icicibank #tcs have nearly O=H. (Give or take few points)
— Pankaj DP (@voPAtrader) March 10, 2022
Rarely this happens.


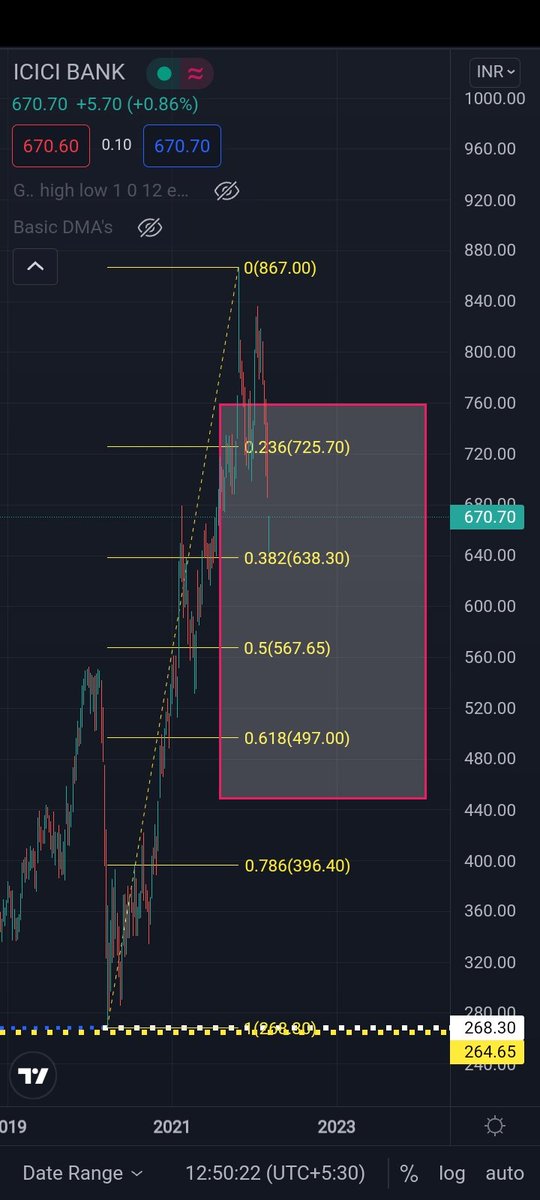
If MA20>MA50; 1 point
If close > Previous month high; 1 point
If close abv past 52 week high; 1 point
If volume on green days> vol on red days;1 point
Likewise....
create ur own conditions and assess the stocks across NSE & rank them
sir for example if i trade on pivot points then how should i rank the setup
— Ayyush Agrawal (@agrawal_ayyush) March 9, 2022


Result?
1850$ to 2070$
Updated chart https://t.co/l6pEGD7r6D
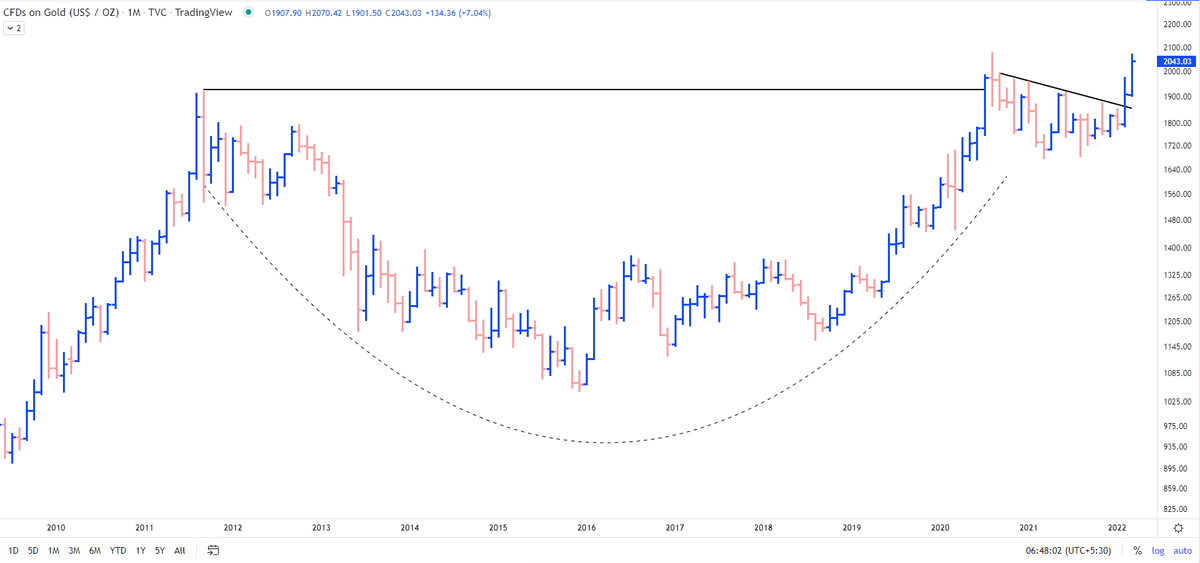
Most interesting chart:
— The_Chartist \U0001f4c8 (@charts_zone) February 12, 2022
Orange line = Gold
Blue Curve = Gold/S&P 500
Previously the ratio crossed 50 days MA in Feb' 20 with Gold giving a breakout on the charts. The previous cross of 50 days MA didn't result in gold breaking out. pic.twitter.com/HRG1fvsILp