Alex1Powell Categories Crypto
7 days
30 days
All time
Recent
Popular
1/ Why the price to sales ratio (P/S) is a useful tool for crypto investors 👇
The price to sales ratio compares a protocol’s market cap to its revenues. A low ratio could imply that the protocol is undervalued and vice versa.
2/ The P/S ratio is an ideal valuation method for early-stage protocols, which often have little or no net income.
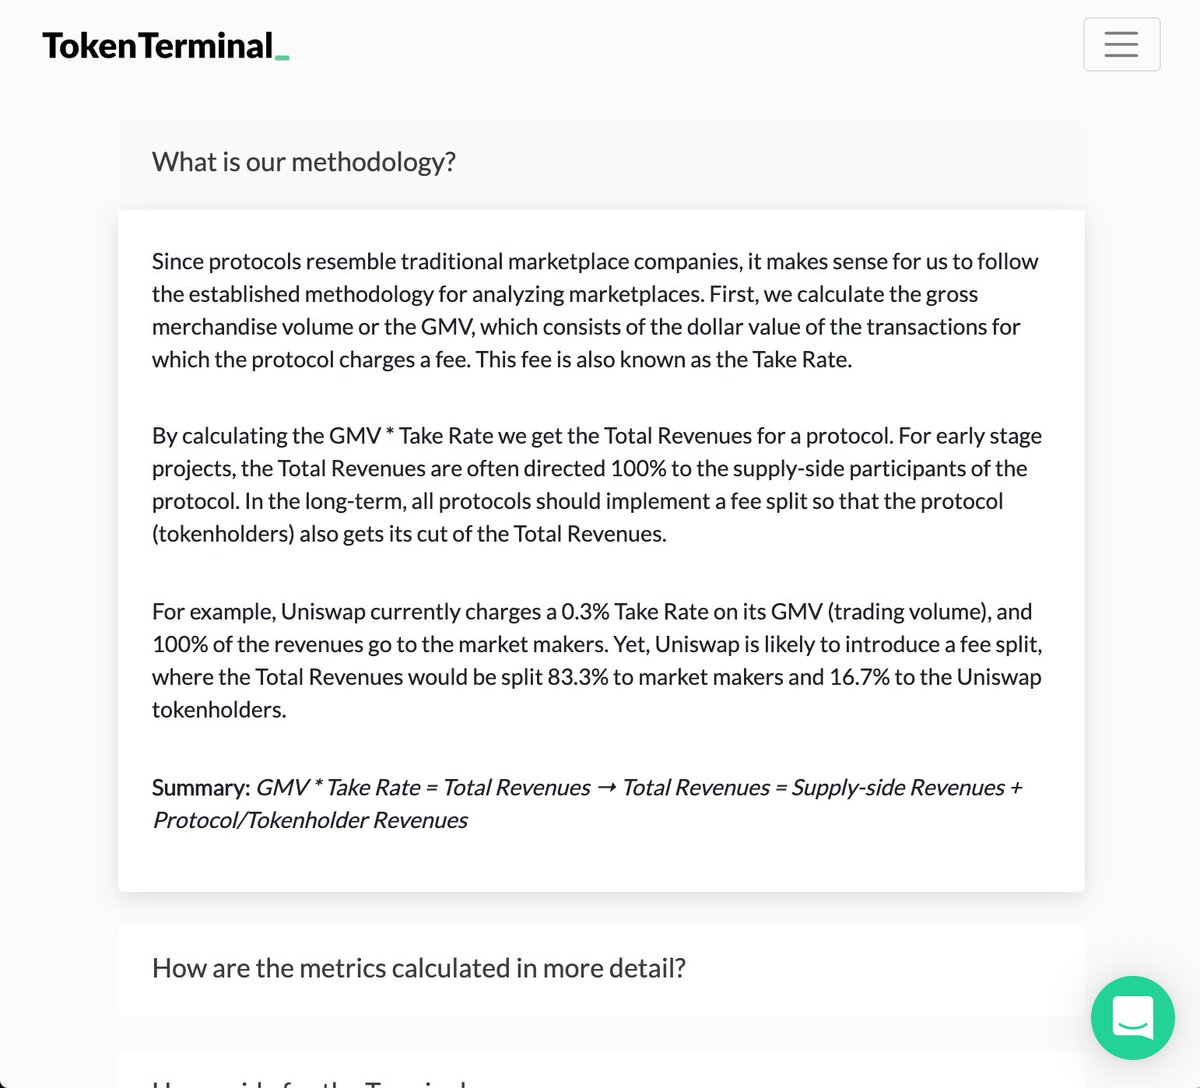
Instead, the P/S ratio focuses on the usage of a protocol, by tracking the total fees paid (revenue) by the users of its service. More info: https://t.co/XlHI7XPTvI

3/ We’re in a historically unique position, with early-stage & high-growth startups operating transparently on-chain.
This transparency makes it possible to find protocols with high usage relative to market cap.
4/ Top dapps from Token Terminal sorted based on the price to sales (P/S) ratio.
Note: Maker has gone from a high P/S ratio to #3 in a matter of months after raising the stability fees for DAI.
Also, two currently similar AMMs (Uniswap & SushiSwap) have the lowest P/S ratios.

5/ Let's look at the P/S ratios from a historical perspective.
The P/S ratio is calculated by dividing a project’s fully-diluted market cap by its annualized revenues.
The metric itself does not tell us about the growth patterns in a protocol’s market cap or revenues.
The price to sales ratio compares a protocol’s market cap to its revenues. A low ratio could imply that the protocol is undervalued and vice versa.
2/ The P/S ratio is an ideal valuation method for early-stage protocols, which often have little or no net income.
Instead, the P/S ratio focuses on the usage of a protocol, by tracking the total fees paid (revenue) by the users of its service. More info: https://t.co/XlHI7XPTvI

3/ We’re in a historically unique position, with early-stage & high-growth startups operating transparently on-chain.
This transparency makes it possible to find protocols with high usage relative to market cap.
4/ Top dapps from Token Terminal sorted based on the price to sales (P/S) ratio.
Note: Maker has gone from a high P/S ratio to #3 in a matter of months after raising the stability fees for DAI.
Also, two currently similar AMMs (Uniswap & SushiSwap) have the lowest P/S ratios.

5/ Let's look at the P/S ratios from a historical perspective.
The P/S ratio is calculated by dividing a project’s fully-diluted market cap by its annualized revenues.
The metric itself does not tell us about the growth patterns in a protocol’s market cap or revenues.


