Mymanish91's Categories
Mymanish91's Authors


Latest Saves


"VOLUME is the ultimate Trading cheat code" PART 2
Please read the FIRST Thread Before Reading this!
https://t.co/IV1HrDlzqk
#StockMarket #stock #volumeintrading
#1 Volume Color Can Create a False Illusion
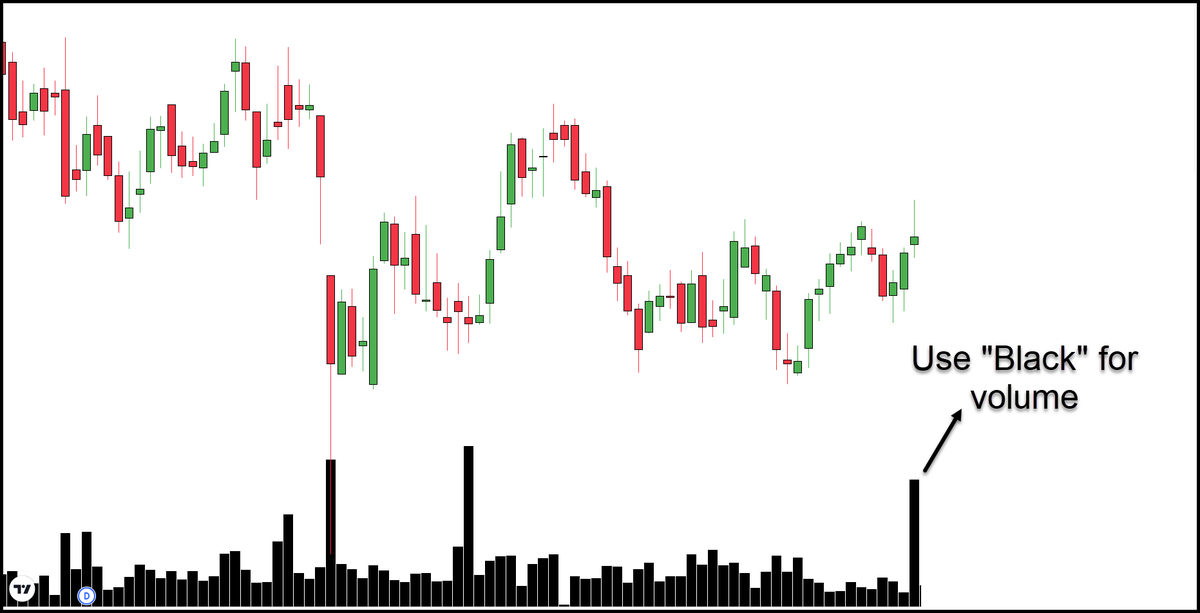
At first look, it looks like a big volume spike.
But if you notice the price candle, it has a big selling wick.
It indicates "SELLING PRESSURE" is high at that time.

We can easily avoid this false impression using the "BLACK" color code across all the volume bars.
Now your mind doesn't assume it is a bullish volume spike!
(If you don't want to use the black color, then view the chart without getting any bias based on the volume color)
#2 Analyze Each Volume Spike Carefully
In this image, the price is breaking the resistance trendline.
How do you say whether it is a genuine breakout or false breakout (from a volume perspective)?

Observe the major Volume Spikes.
A is Bullish (Price moved upside on the next day)
B is Bearish (Price fell on the next day)
C is Bearish (Price moved sideways and fell)
D is Bearish (Price fell on the next day)
So High Probability of FALSE BREAKOUT!

Please read the FIRST Thread Before Reading this!
https://t.co/IV1HrDlzqk
#StockMarket #stock #volumeintrading
VOLUME is the ultimate Trading cheat code.
— Indrazith Shantharaj (@indraziths) August 6, 2022
But, most people never use it in the right way \u2013 because no one ever taught them how.
Here are 10 psychological triggers to knowing Volume in a better way :
#1 Volume Color Can Create a False Illusion
At first look, it looks like a big volume spike.
But if you notice the price candle, it has a big selling wick.
It indicates "SELLING PRESSURE" is high at that time.
We can easily avoid this false impression using the "BLACK" color code across all the volume bars.
Now your mind doesn't assume it is a bullish volume spike!
(If you don't want to use the black color, then view the chart without getting any bias based on the volume color)
#2 Analyze Each Volume Spike Carefully
In this image, the price is breaking the resistance trendline.
How do you say whether it is a genuine breakout or false breakout (from a volume perspective)?
Observe the major Volume Spikes.
A is Bullish (Price moved upside on the next day)
B is Bearish (Price fell on the next day)
C is Bearish (Price moved sideways and fell)
D is Bearish (Price fell on the next day)
So High Probability of FALSE BREAKOUT!


Took me 5 years to get the best Chartink scanners for Stock Market, but you’ll get it in 5 mminutes here ⏰
Do Share the above tweet 👆
These are going to be very simple yet effective pure price action based scanners, no fancy indicators nothing - hope you liked it.
https://t.co/JU0MJIbpRV
52 Week High
One of the classic scanners very you will get strong stocks to Bet on.
https://t.co/V69th0jwBr
Hourly Breakout
This scanner will give you short term bet breakouts like hourly or 2Hr breakout
Volume shocker
Volume spurt in a stock with massive X times