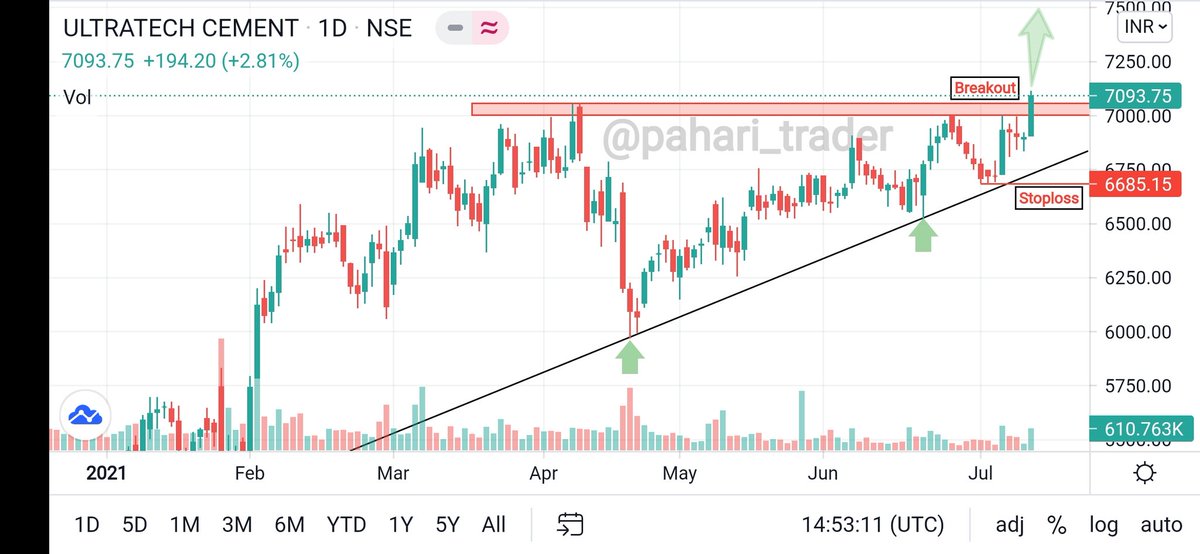
#ULTRACEMCO stock looking bullish, RSI & MACD very strong
Today was results day, volume was very high, if it sustains above 6450, it can rally towards 7080, i.e. 61.8% Fibonacci pullback of last rise
#cement #stocks #nifty
Not trading call, academic post

More from Techno Prince
More from Ultratechcement
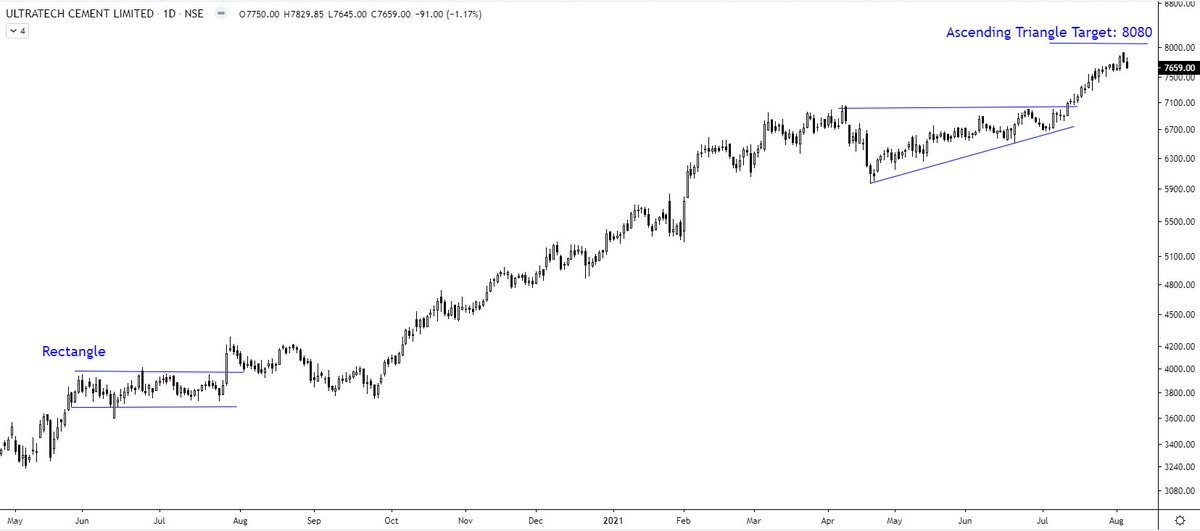
SL 7650 https://t.co/KKnf6a6xlH

Nifty 100 stocks near BO or a few % up/down from BO levels:
— The_Chartist \U0001f4c8 (@nison_steve) September 2, 2021
1. Ultratech Cement
2. Reliance
3. Nestle
4. Abbott India
5. ICICI Lombard
6. IGL
7. Indigo
8. LT
9. Muthoot Finance
10. United Spirits

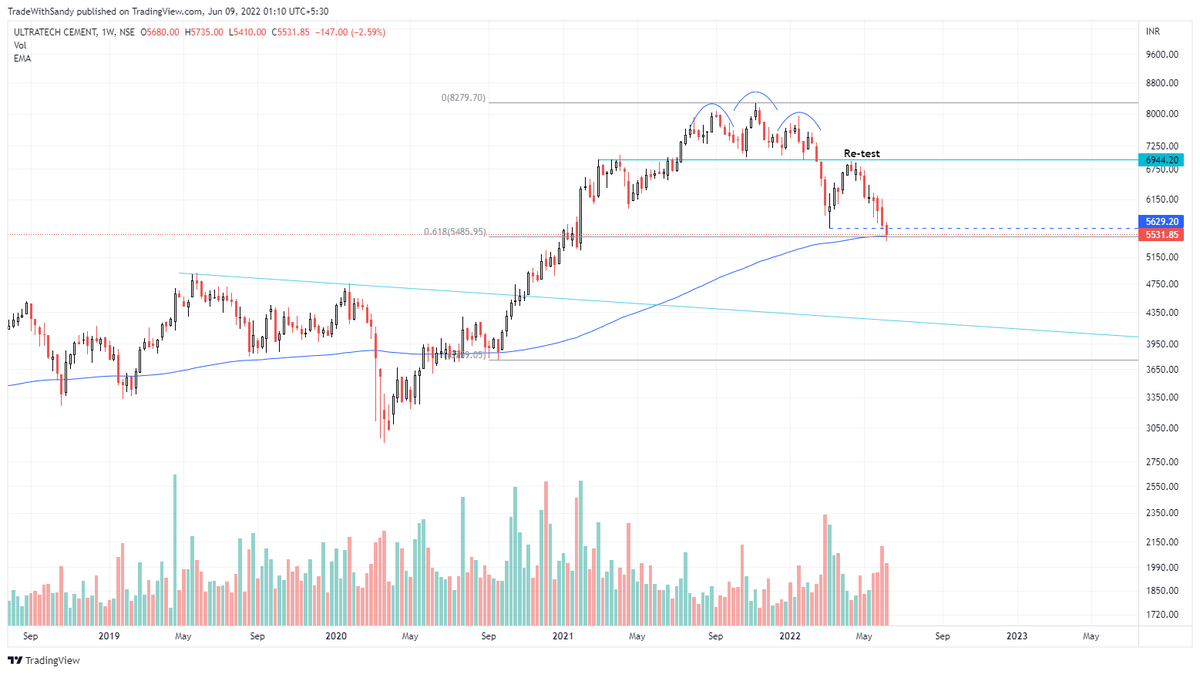
Cement companies are now is good buying zone for long term investors. Downside may not be more than 10-15% at max. Valuations extremely attractive.
— Sandeep Kulkarni (@moneyworks4u_fa) June 8, 2022
As far as I remember cement business has always been a cartel for atleast past 20 yrs.
6.857% ....7135
#Observation
#ULTRACEMCO
— MaRkET WaVES (DINESH PATEL ) Stock Market FARMER (@idineshptl) April 8, 2021
1st image.
6.857% is at 7135. Sustain above this upside projection for long term perspective 11425-18401-29182.
2nd image show current trend Probabilty
#Fibonacci
#Retracement
#Extension
#wave principle pic.twitter.com/Jo5kZ5S0gg
You May Also Like
Those who exited at 1500 needed money. They can always come back near 969. Those who exited at 230 also needed money. They can come back near 95.
Those who sold L @ 660 can always come back at 360. Those who sold S last week can be back @ 301
Sir, Log yahan.. 13 days patience nhi rakh sakte aur aap 2013 ki baat kar rahe ho. Even Aap Ready made portfolio banakar bhi de do to bhi wo 1 month me hi EXIT kar denge \U0001f602
— BhavinKhengarSuratGujarat (@IntradayWithBRK) September 19, 2021
Neuland 2700 se 1500 & Sequent 330 to 230 kya huwa.. 99% retailers/investors twitter par charcha n EXIT\U0001f602
This New York Times feature shows China with a Gini Index of less than 30, which would make it more equal than Canada, France, or the Netherlands. https://t.co/g3Sv6DZTDE
That's weird. Income inequality in China is legendary.
Let's check this number.
2/The New York Times cites the World Bank's recent report, "Fair Progress? Economic Mobility across Generations Around the World".
The report is available here:
3/The World Bank report has a graph in which it appears to show the same value for China's Gini - under 0.3.
The graph cites the World Development Indicators as its source for the income inequality data.

4/The World Development Indicators are available at the World Bank's website.
Here's the Gini index: https://t.co/MvylQzpX6A
It looks as if the latest estimate for China's Gini is 42.2.
That estimate is from 2012.
5/A Gini of 42.2 would put China in the same neighborhood as the U.S., whose Gini was estimated at 41 in 2013.
I can't find the <30 number anywhere. The only other estimate in the tables for China is from 2008, when it was estimated at 42.8.