Step 1: Finding Good Chart Setups (continued)
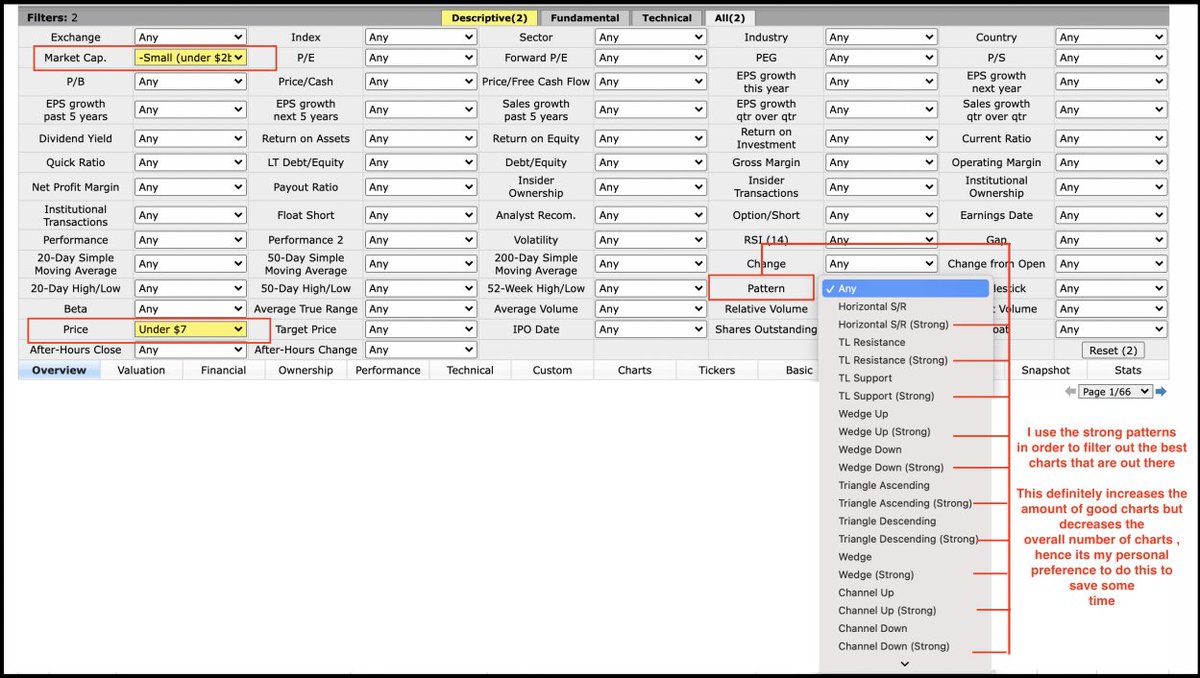
Attached below is my personal finviz screener settings which I use to look at charts and how I
change some of the settings to my own preferences.
Site Reference:
https://t.co/liI2ktnHhz PS: Sometimes I don't even select any pattern
My favorite bullish chart setups that I personally look out for initiating swing positions:
1-) Falling Wedge Pattern
2-) Ascending Triangle Pattern
3-) Fish Hook / Oversold Bounce Pattern
4-) Channel Up Pattern
5-) Descending Triangle Breakout Pattern ( Towards Upside)
Step 2: Checking for Offerings
Once I have found a good chart, with a high risk reward ratio, the immediate first thing that I
do is to look out for any signs of upcoming offering. Since I don’t want to get caught in
offerings , these are the two things that I lookout for.
Step 2: Checking for Offerings (continued)
1-) Firstly, I look for whether the company had made any recent offerings in the last two months, if yes then there are less chances of new offerings.
Step 2: Checking for Offerings (continued)
2-) I look for S-3 filings at
https://t.co/7BwDkXhZ8w, if any S-3’s are currently open or by looking at
the details and seeing whether they have completed the number of offerings in dollar value after
the S-3 Filings.
My favorite bullish chart setups that I personally look out for initiating swing positions:
1-) Falling Wedge Pattern
2-) Ascending Triangle Pattern
3-) Fish Hook / Oversold Bounce Pattern
4-) Channel Up Pattern
5-) Descending Triangle Breakout Pattern ( Towards Upside)
Step 2: Checking for Offerings
Once I have found a good chart, with a high risk reward ratio, the immediate first thing that I
do is to look out for any signs of upcoming offering. Since I don’t want to get caught in
offerings , these are the two things that I lookout for.
Step 2: Checking for Offerings (continued)
1-) Firstly, I look for whether the company had made any recent offerings in the last two months, if yes then there are less chances of new offerings.
Step 2: Checking for Offerings (continued)
2-) I look for S-3 filings at
https://t.co/7BwDkXhZ8w, if any S-3’s are currently open or by looking at
the details and seeing whether they have completed the number of offerings in dollar value after
the S-3 Filings.
Step 3: Finding Catalysts
Once I clear the offerings off the list, the next thing that I need to look out for is catalyst and upcoming milestones for a company. To do this step, I read and skim through the company’s PR available at https:https://t.co/rYpslSOE1R.
Here are some of the major catalysts examples:
1-) (Phase 2 , Phase 3) drug results - (FDA and PDUFA) dates.
2-) Contract with companies like Amazon , Microsoft , Walmart.
3-) Contracts above (1 - 100M$)
4-) Merger and Acquisitions
5-) Covid-19 Vaccine Related Data
6-) Insider
I have attached below some examples which caused huge runs on some of the tickers below, the key is to anticipate them before they release the news and that can only be done if you look out for catalysts in the company PR’s
Step 4: Checking Company Fundamentals
Once I have found catalysts that I think can effect company’s price then the only thing left to do is check out the company’s fundamentals outlook.
Continued 🔽🔽
I check a company’s fundamental to just be sure that a company is not a fraudulent company and it's not going to announce offerings due to lack of funds.
To do so , I use the website,
https://t.co/6pozcKB3cQ, and go into statistics tab to check for their balance sheet outlook .
I would like to see that the company’s total
cash is much greater than the
company’s total debt which tells me that
the company would be able to pay of its
immediate debts.
Another thing that I look
out for is the operating cash flow, I have
seen that usually tickers having positive
cash flow do relatively well for me while I
open up a swing trade. If the Total Debt is near the Total Cash or greater than it ,I avoid taking
positions in that ticker.
Step 5: Charting Done Right
This is the final stage before entering the swing, I never rely on charts from finviz always do my personal charting on each and every ticker.
Ex. I have Attached below a comparison of my charting and finviz charting on the
following ticker name $DSP
I do this is because I set alerts on key support and resistance areas and the only
time I buy a stock is when it hits the support area , because that’s where I have the best risk
reward ratio.Knowing that DSP is a good long term stock , 11.50$ is a great area.
Hope y'all enjoyed this thread. Let me know what other threads you want.
$BKKT $EQOS $GREE $GFAI $NXTD