
That time everyone in Omaha forgot about Berkshire and went crazy for a bubble stock: Level 3 Communications.

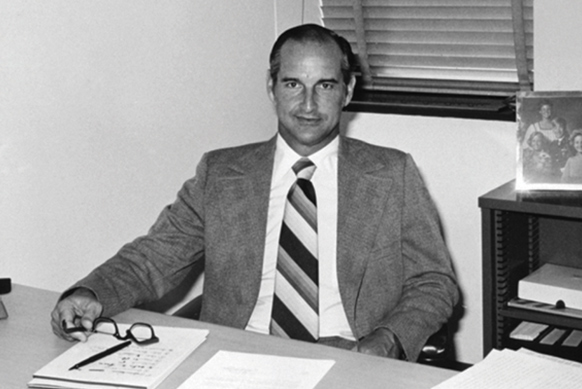
Crowe renamed it MFS and started building his own networks. It became a competitive local-exchange carrier (CLEC). It spun out and went public in 1993.
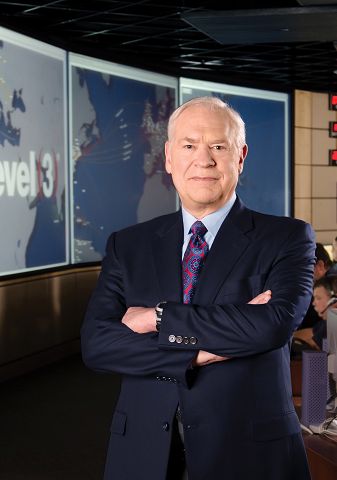
Bill Gates gave a speech about the revolutionary nature of the internet and how it could make traditional phone companies obsolete.
Scott: "Bill's talk is probably what got us thinking about the Internet."
For $14 billion.
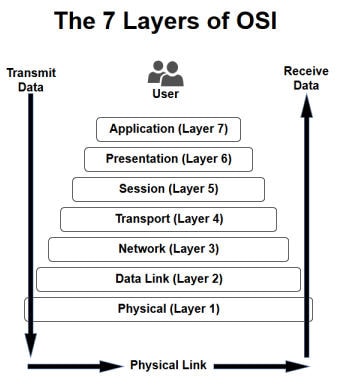
In 1997, Level 3 was formed within Kiewit Diversified with $2 billion in seed money. (Level 3 because it covered the lower three layers in the OSI model.)
"Our design goal is not to try to guess where design technology will take us five years from now. Our goal is to build a network that can accommodate unprecedented technological change.
"People made a bunch of money on MFS. That set the stage for people buying Level 3. It reinforced the idea that Kiewit never misses. But people began to think about it like you could get rich overnight."
By March 2000, it reached $130 per share or a market cap of $44 billion.
https://t.co/6IVpzCObFM
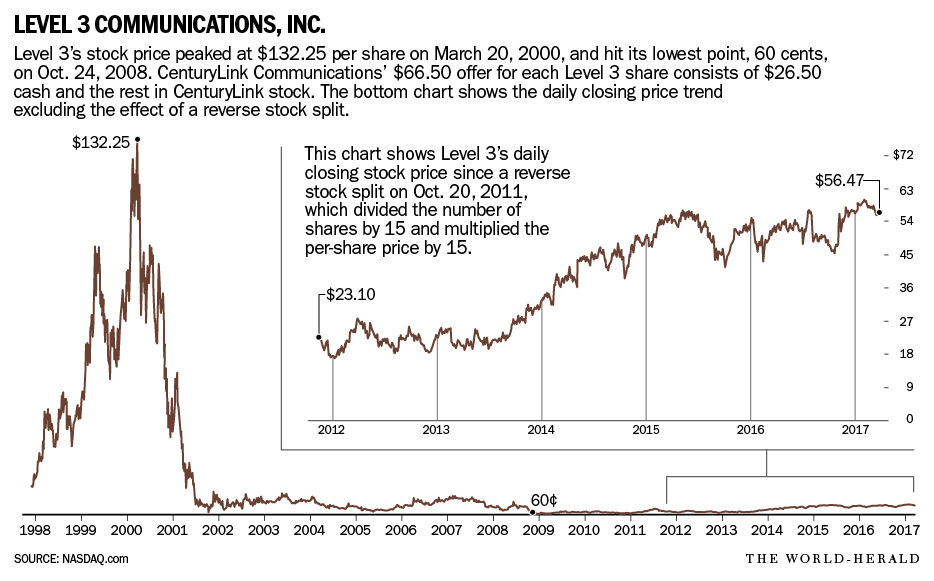
In 2002, Buffett actually invested $100 million.
James Crowe did. Why? "In the beginning I borrowed money to buy $55 million of Level 3 stock. I needed to pay off that debt."
“I wanted to stick around until I was convinced that Level 3 was solidly on a path toward its destiny”
https://t.co/F2NxC00vxp
"Craig McCaw said to me during this period: “You are always at the mercy of your stupidest competitors.”
"Om Malik estimated that $750 billion vanished when the telecom bubble burst."
https://t.co/Bt6PEMHwbF
https://t.co/IEwz89PDYs
& detailed company history:
https://t.co/DdlRz17PNa
More from Trading




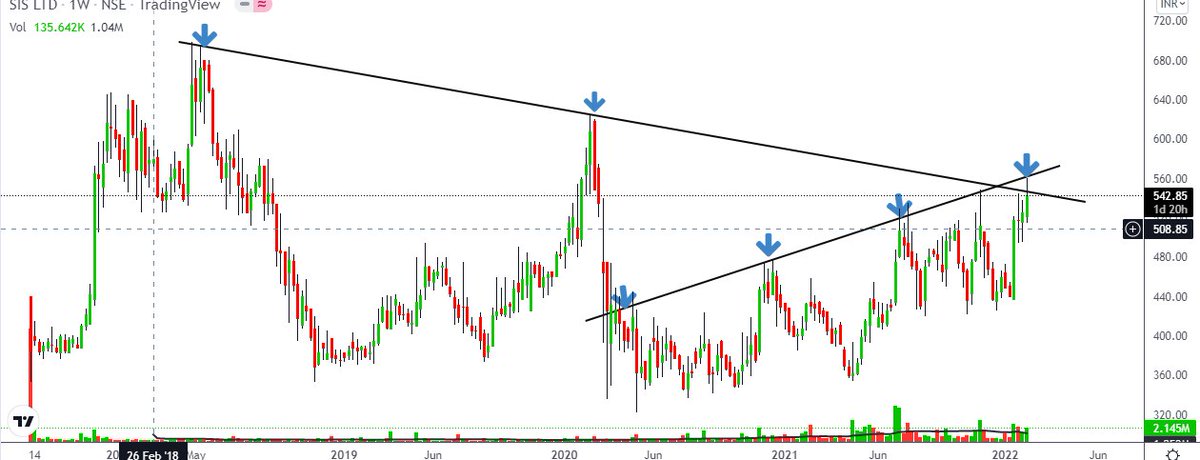


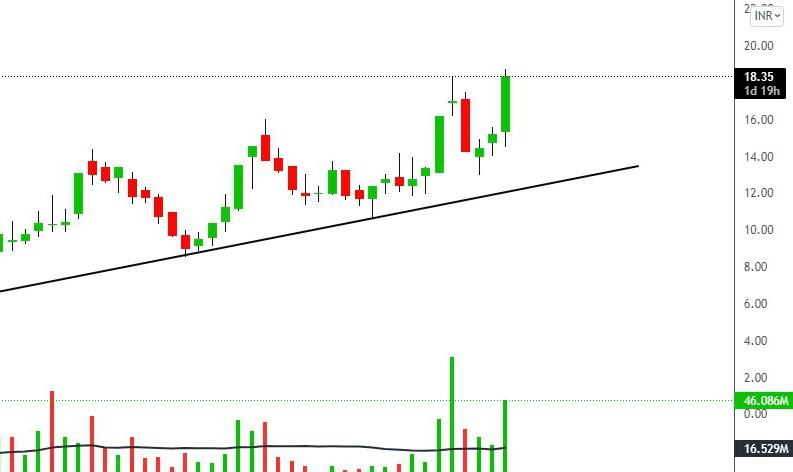

I spent over 100 hours studying the best patterns in Technical Analysis taught to me by @niki_poojary.
Turns out, patterns trading is simple—if you follow these 8 Patterns:
Let's start: ↓
While studying her Twitter profile and with constant talks with her, I found these to be the most important patterns she focuses on always.
Then I wrote a small summary of what each pattern means.
Also attached are some examples from her tweets.
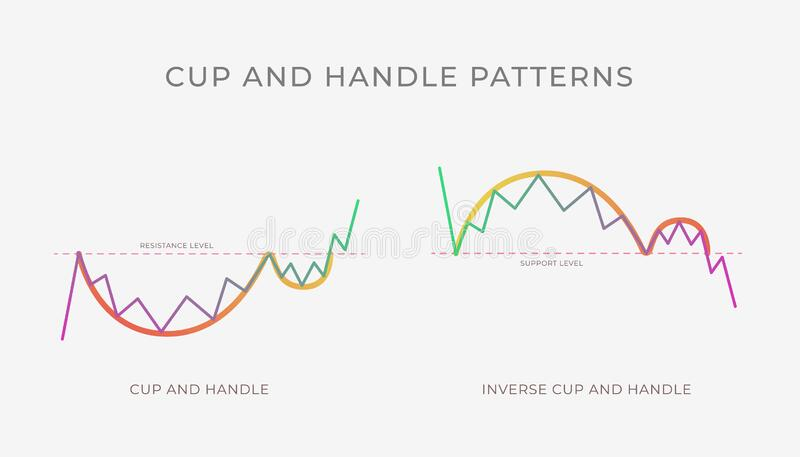
1/ Cup and handle Pattern
Happens during an uptrend.
The cup portion has a U-shaped appearance.
The bears are getting weaker as they are unable to drive the prices below the last low.
Subhasish Pani uses this a lot in stocks to spot bullish trades.
Eg
Eg
Turns out, patterns trading is simple—if you follow these 8 Patterns:
Let's start: ↓
While studying her Twitter profile and with constant talks with her, I found these to be the most important patterns she focuses on always.
Then I wrote a small summary of what each pattern means.
Also attached are some examples from her tweets.
1/ Cup and handle Pattern
Happens during an uptrend.
The cup portion has a U-shaped appearance.
The bears are getting weaker as they are unable to drive the prices below the last low.
Subhasish Pani uses this a lot in stocks to spot bullish trades.
Eg
5: When to play directional:
— Nikita Poojary (@niki_poojary) December 18, 2022
Whenever the index is moving in a single direction, its important to go with the trend.
A few weeks ago when BNF broke out of the cup and handle pattern, all we had to do was sell PEs.
Pls note: weekly TF chart is attached to just show the C&H BO pic.twitter.com/z0wgUzJW8t
Eg
#VOLTAS Another cup & handle pattern for cash positional pic.twitter.com/Jsc99xJfwY
— Nikita Poojary (@niki_poojary) October 23, 2019
You May Also Like









On the occasion of youtube 20k and Twitter 70k members
A small tribute/gift to members
Screeners
technical screeners - intraday and positional both
before proceeding - i have helped you , can i ask you so that it can help someone else too
thank you
positional one
run - find #stock - draw chart - find levels
1- Stocks closing daily 2% up from 5 days
https://t.co/gTZrYY3Nht
2- Weekly breakout
https://t.co/1f4ahEolYB
3- Breakouts in short term
https://t.co/BI4h0CdgO2
4- Bullish from last 5
intraday screeners
5- 15 minute Stock Breakouts
https://t.co/9eAo82iuNv
6- Intraday Buying seen in the past 15 minutes
https://t.co/XqAJKhLB5G
7- Stocks trading near day's high on 5 min chart with volume BO intraday
https://t.co/flHmm6QXmo
Thank you
A small tribute/gift to members
Screeners
technical screeners - intraday and positional both
before proceeding - i have helped you , can i ask you so that it can help someone else too
thank you
positional one
run - find #stock - draw chart - find levels
1- Stocks closing daily 2% up from 5 days
https://t.co/gTZrYY3Nht
2- Weekly breakout
https://t.co/1f4ahEolYB
3- Breakouts in short term
https://t.co/BI4h0CdgO2
4- Bullish from last 5
intraday screeners
5- 15 minute Stock Breakouts
https://t.co/9eAo82iuNv
6- Intraday Buying seen in the past 15 minutes
https://t.co/XqAJKhLB5G
7- Stocks trading near day's high on 5 min chart with volume BO intraday
https://t.co/flHmm6QXmo
Thank you


