
Want to see two absolutely crazy, shady, frustrating charts? (warning: they're confusing, I'll explain)
These charts, which show stock price, volume, short interest, and short volume, tell the story of what happened over the past few days.
Left: $AMC, Right: $GME
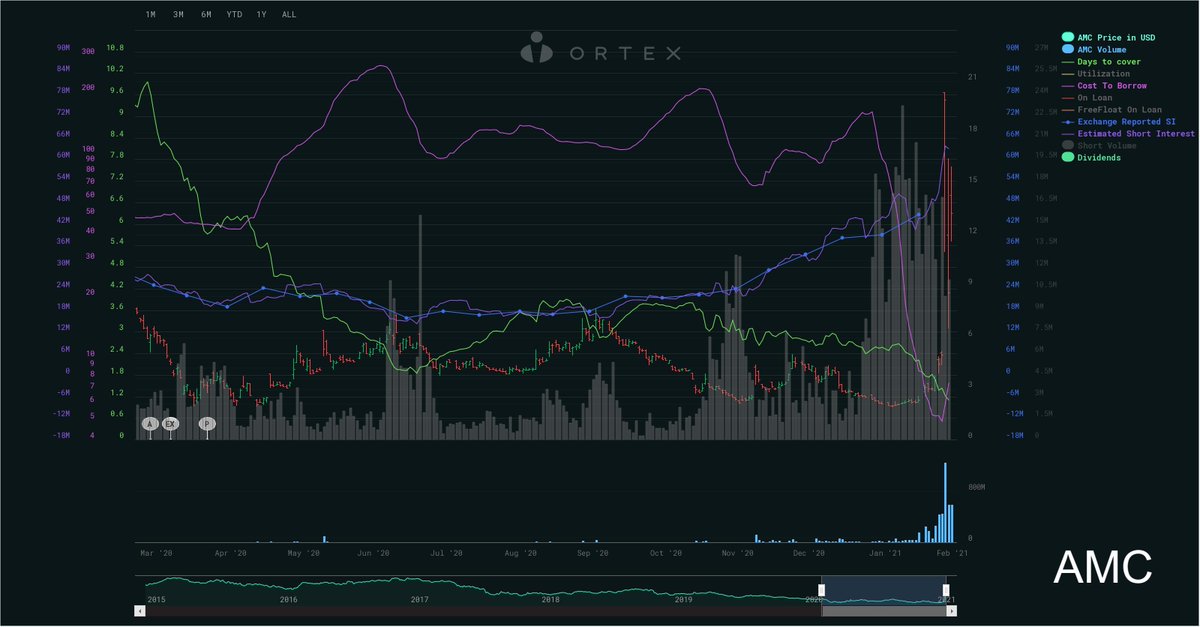
On Wednesday night, the requirements for certain extremely volatile stocks like GME skyrocketed.
Something like 50% of RH traders were/are holding GME.
Even so, they limited trading of these tickers (stocks).
And short sellers took advantage of this. When the prices fell, a ton of them closed out their high-cost GME position.
More from Trading


You May Also Like


I hate when I learn something new (to me) & stunning about the Jeff Epstein network (h/t MoodyKnowsNada.)
Where to begin?
So our new Secretary of State Anthony Blinken's stepfather, Samuel Pisar, was "longtime lawyer and confidant of...Robert Maxwell," Ghislaine Maxwell's Dad.
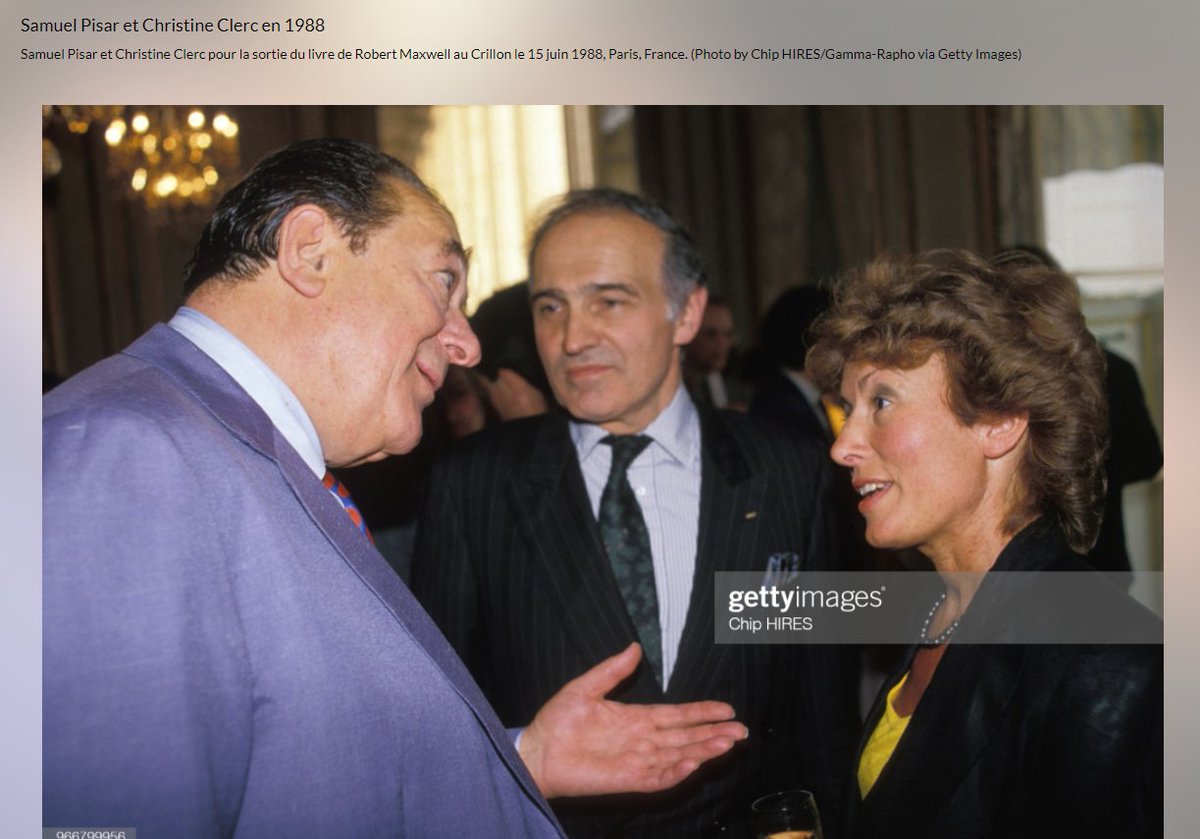
"Pisar was one of the last people to speak to Maxwell, by phone, probably an hour before the chairman of Mirror Group Newspapers fell off his luxury yacht the Lady Ghislaine on 5 November, 1991." https://t.co/DAEgchNyTP
OK, so that's just a coincidence. Moving on, Anthony Blinken "attended the prestigious Dalton School in New York City"...wait, what? https://t.co/DnE6AvHmJg
Dalton School...Dalton School...rings a
Oh that's right.
The dad of the U.S. Attorney General under both George W. Bush & Donald Trump, William Barr, was headmaster of the Dalton School.
Donald Barr was also quite a
I'm not going to even mention that Blinken's stepdad Sam Pisar's name was in Epstein's "black book."
Lots of names in that book. I mean, for example, Cuomo, Trump, Clinton, Prince Andrew, Bill Cosby, Woody Allen - all in that book, and their reputations are spotless.
Where to begin?
So our new Secretary of State Anthony Blinken's stepfather, Samuel Pisar, was "longtime lawyer and confidant of...Robert Maxwell," Ghislaine Maxwell's Dad.
"Pisar was one of the last people to speak to Maxwell, by phone, probably an hour before the chairman of Mirror Group Newspapers fell off his luxury yacht the Lady Ghislaine on 5 November, 1991." https://t.co/DAEgchNyTP
OK, so that's just a coincidence. Moving on, Anthony Blinken "attended the prestigious Dalton School in New York City"...wait, what? https://t.co/DnE6AvHmJg
Dalton School...Dalton School...rings a
Oh that's right.
The dad of the U.S. Attorney General under both George W. Bush & Donald Trump, William Barr, was headmaster of the Dalton School.
Donald Barr was also quite a
Donald Barr had a way with words. pic.twitter.com/JdRBwXPhJn
— Rudy Havenstein, listening to Nas all day. (@RudyHavenstein) September 17, 2020
I'm not going to even mention that Blinken's stepdad Sam Pisar's name was in Epstein's "black book."
Lots of names in that book. I mean, for example, Cuomo, Trump, Clinton, Prince Andrew, Bill Cosby, Woody Allen - all in that book, and their reputations are spotless.

I’m torn on how to approach the idea of luck. I’m the first to admit that I am one of the luckiest people on the planet. To be born into a prosperous American family in 1960 with smart parents is to start life on third base. The odds against my very existence are astronomical.
I’ve always felt that the luckiest people I know had a talent for recognizing circumstances, not of their own making, that were conducive to a favorable outcome and their ability to quickly take advantage of them.
In other words, dumb luck was just that, it required no awareness on the person’s part, whereas “smart” luck involved awareness followed by action before the circumstances changed.
So, was I “lucky” to be born when I was—nothing I had any control over—and that I came of age just as huge databases and computers were advancing to the point where I could use those tools to write “What Works on Wall Street?” Absolutely.
Was I lucky to start my stock market investments near the peak of interest rates which allowed me to spend the majority of my adult life in a falling rate environment? Yup.
Ironies of Luck https://t.co/5BPWGbAxFi
— Morgan Housel (@morganhousel) March 14, 2018
"Luck is the flip side of risk. They are mirrored cousins, driven by the same thing: You are one person in a 7 billion player game, and the accidental impact of other people\u2019s actions can be more consequential than your own."
I’ve always felt that the luckiest people I know had a talent for recognizing circumstances, not of their own making, that were conducive to a favorable outcome and their ability to quickly take advantage of them.
In other words, dumb luck was just that, it required no awareness on the person’s part, whereas “smart” luck involved awareness followed by action before the circumstances changed.
So, was I “lucky” to be born when I was—nothing I had any control over—and that I came of age just as huge databases and computers were advancing to the point where I could use those tools to write “What Works on Wall Street?” Absolutely.
Was I lucky to start my stock market investments near the peak of interest rates which allowed me to spend the majority of my adult life in a falling rate environment? Yup.

"I really want to break into Product Management"
make products.
"If only someone would tell me how I can get a startup to notice me."
Make Products.
"I guess it's impossible and I'll never break into the industry."
MAKE PRODUCTS.
Courtesy of @edbrisson's wonderful thread on breaking into comics – https://t.co/TgNblNSCBj – here is why the same applies to Product Management, too.
There is no better way of learning the craft of product, or proving your potential to employers, than just doing it.
You do not need anybody's permission. We don't have diplomas, nor doctorates. We can barely agree on a single standard of what a Product Manager is supposed to do.
But – there is at least one blindingly obvious industry consensus – a Product Manager makes Products.
And they don't need to be kept at the exact right temperature, given endless resource, or carefully protected in order to do this.
They find their own way.
make products.
"If only someone would tell me how I can get a startup to notice me."
Make Products.
"I guess it's impossible and I'll never break into the industry."
MAKE PRODUCTS.
Courtesy of @edbrisson's wonderful thread on breaking into comics – https://t.co/TgNblNSCBj – here is why the same applies to Product Management, too.
"I really want to break into comics"
— Ed Brisson (@edbrisson) December 4, 2018
make comics.
"If only someone would tell me how I can get an editor to notice me."
Make Comics.
"I guess it's impossible and I'll never break into the industry."
MAKE COMICS.
There is no better way of learning the craft of product, or proving your potential to employers, than just doing it.
You do not need anybody's permission. We don't have diplomas, nor doctorates. We can barely agree on a single standard of what a Product Manager is supposed to do.
But – there is at least one blindingly obvious industry consensus – a Product Manager makes Products.
And they don't need to be kept at the exact right temperature, given endless resource, or carefully protected in order to do this.
They find their own way.