#TITAN looks good as per daily chart but i would not suggest to add at current price https://t.co/ZAUoU9x5zg
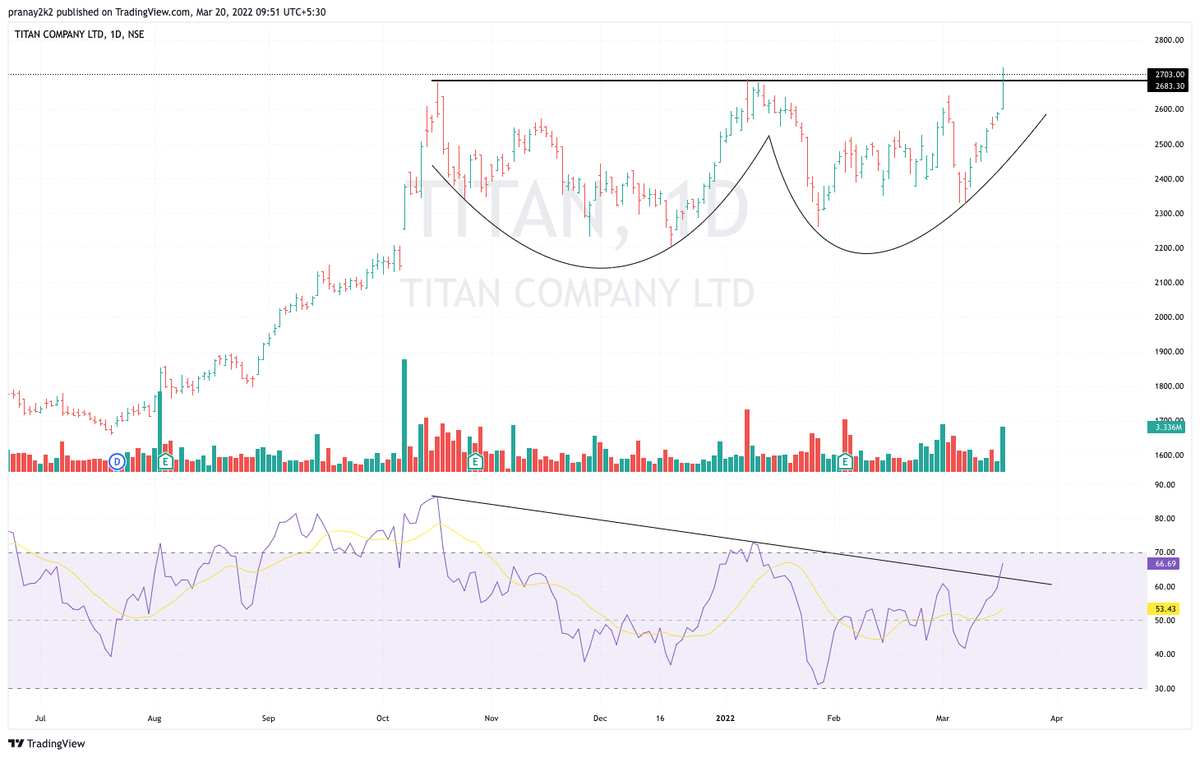
Titan \u263a\ufe0f
— Mateen khan (@KhaansKhan) March 19, 2022
More from Pranay Prasun
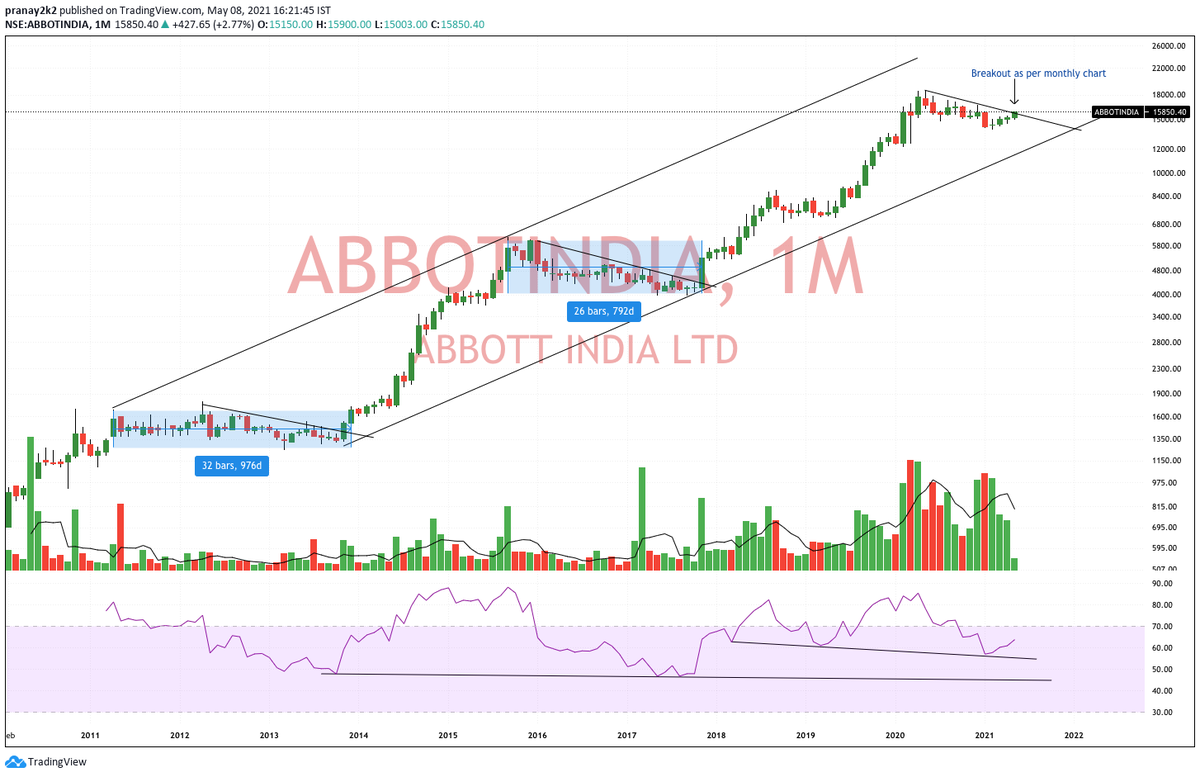
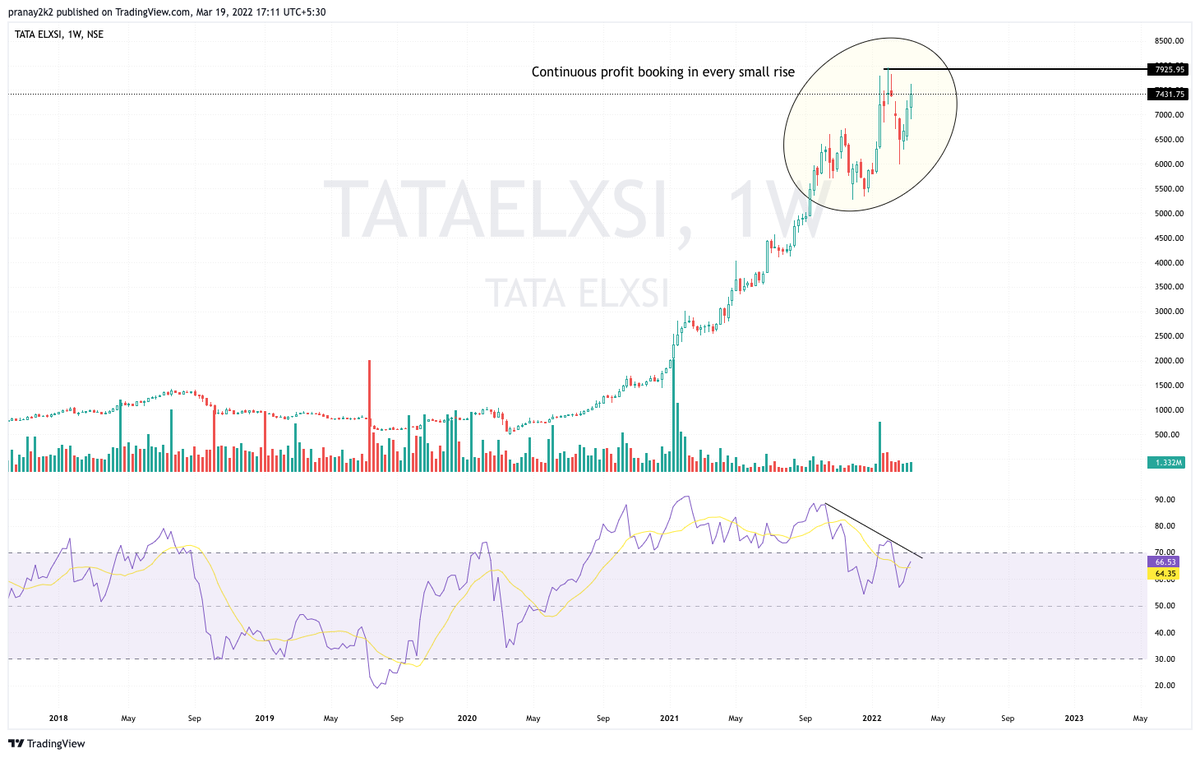
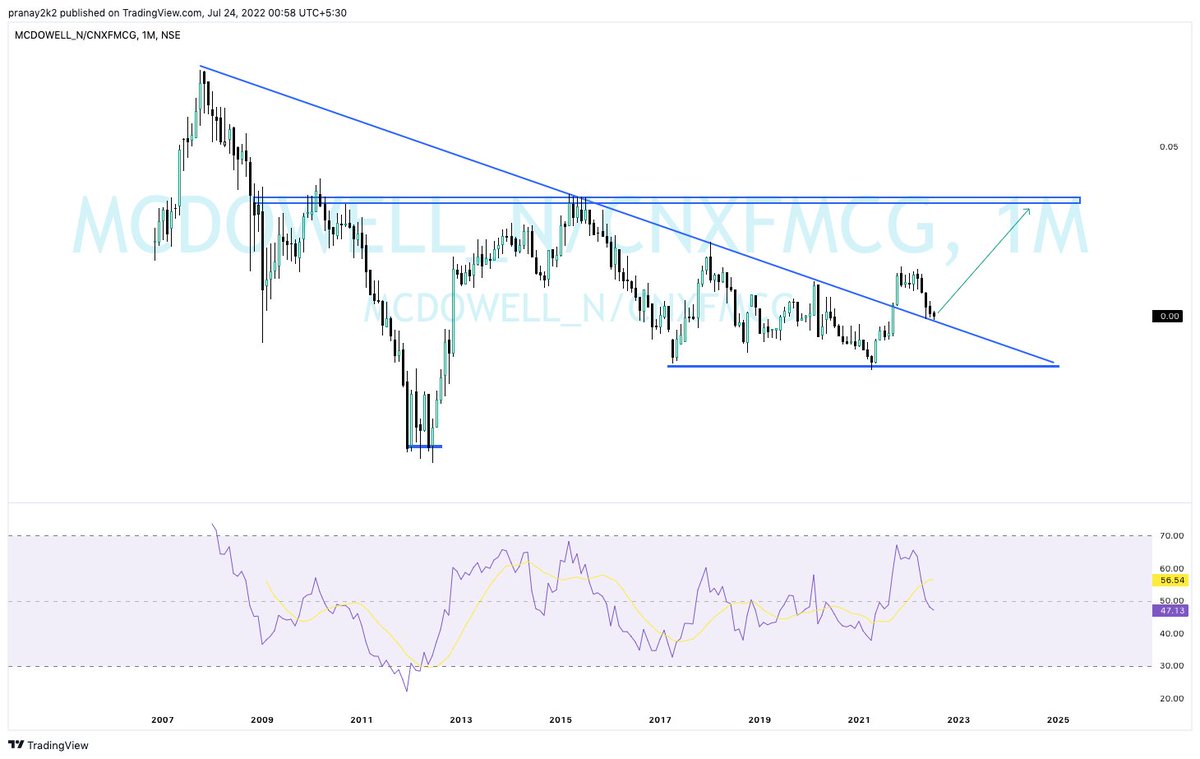
Key points : 👇
~ RSI breakout retest in weekly chart
~ HH &HL pattern ,Price action still bullish
~ Huge support as per ratio chart.
#CNXFMCG #Nifty
#ITC I drilled further by #CNXFMCG index
— Pranay Prasun (@PranayPrasun) July 3, 2021
Keypoints :
~ Near huge support as per weekly chart
~ #RSI Breakout retest #Ratiochart
Conclusion : Bounceback expected
Timeframe : Weekly , So please avoid daily movement .@piyushchaudhry @gogrithekhabri @Deishma @pratyush_rohit https://t.co/PKbi7mdoam pic.twitter.com/MUWBSX2LlB
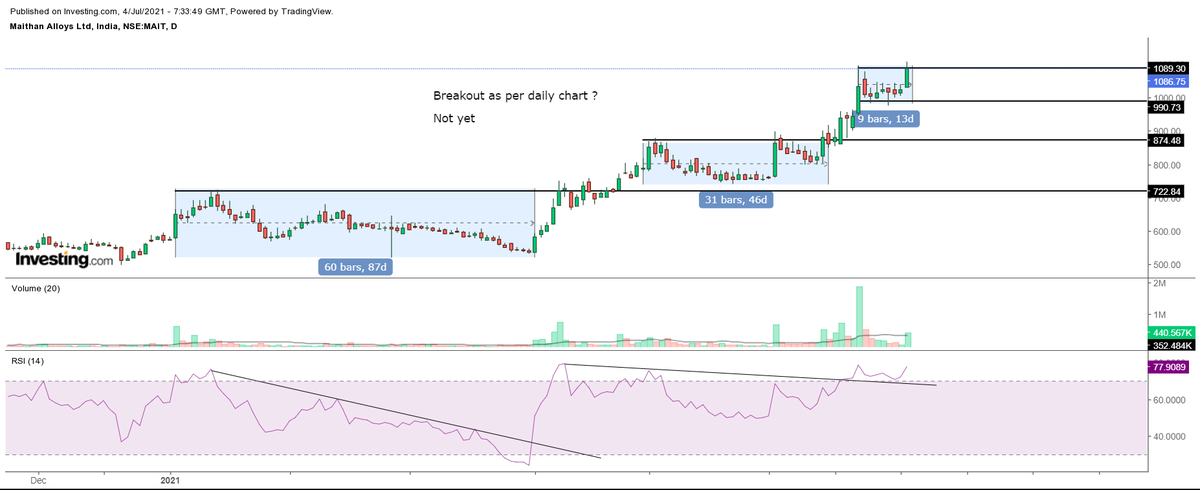
#Maithanalloys #Publicdemand\U0001f600
— Pranay Prasun (@PranayPrasun) July 4, 2021
Highlighted at 560\U0001f525 level and i'm going to cover all major timeframes \U0001f447
~ What next ?
~ When to add ?
~ Immediate target
~ stop loss https://t.co/v1qWY5TrYQ
#USL #Unitedspirits #DIAGEO Shared daily chart for reference \U0001f447
— Pranay Prasun (@PranayPrasun) May 27, 2022
Here breakout candle is supported by volume https://t.co/MXsPJMNHDF pic.twitter.com/rTLQhfCXfg
More from Titan
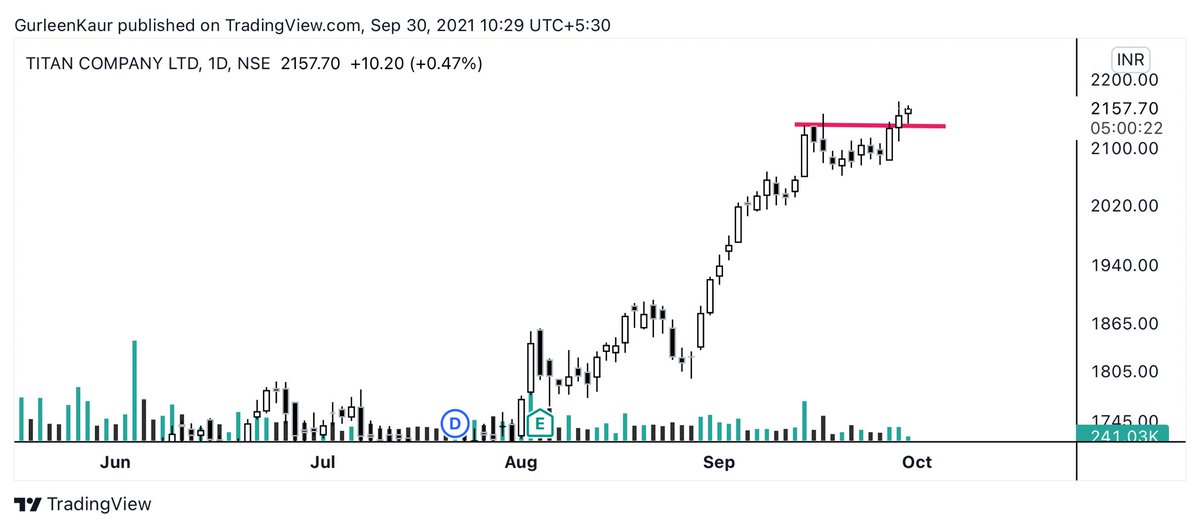
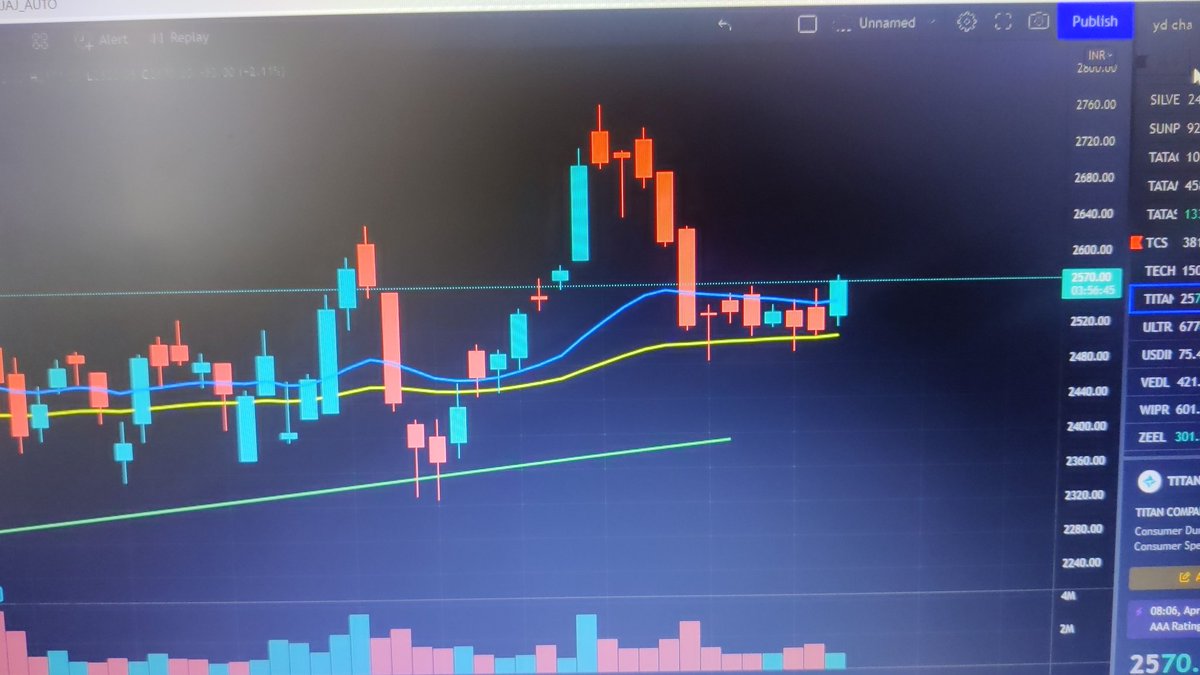
Coming out of consolidation. Added more longs. Expecting new high.
#trading
#TITAN - A false breakout at ATH trapping late bulls. In non trending markets its common that strong breakouts fail.
— Yash Dugar (@ydstartupreneur) March 28, 2022
However as per the R:R theory of buy which I shared yesterday will go long abv today's high with low as S.L as reversal at 61.8 retracement with doji.
Views ?? pic.twitter.com/jlCFtXAEiX
Coming out of last 6 days range, consolidation with good volumes till now. More strength on closing abv 2570 👍
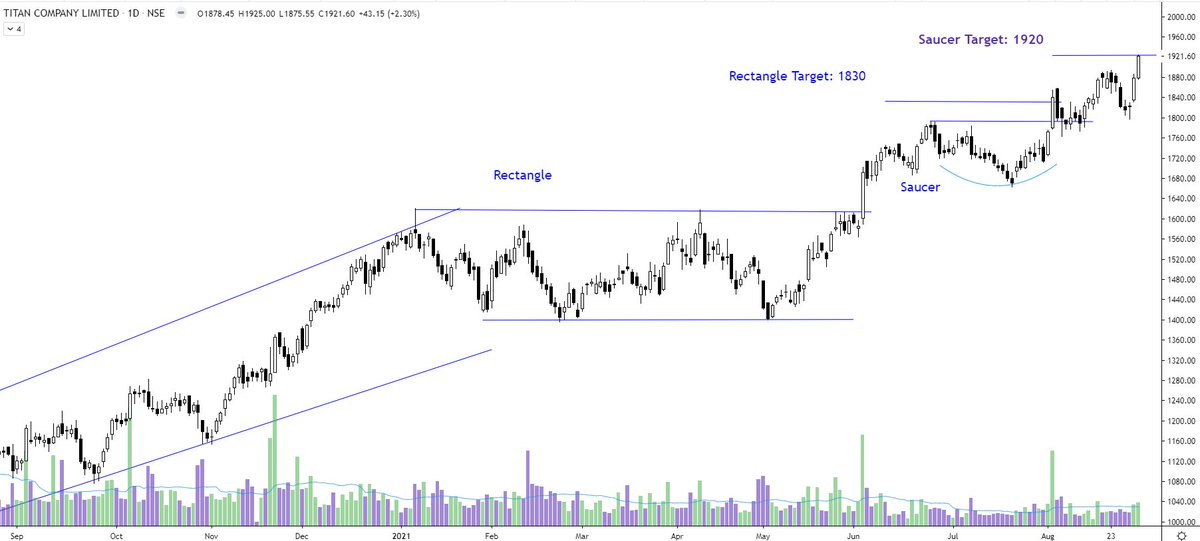
Titan - beautifully on track. Rectangle target done. And now one minor saucer target of 1920. https://t.co/t2OQLibJIs pic.twitter.com/tM5hiLg99e
— The_Chartist \U0001f4c8 (@nison_steve) August 22, 2021
You May Also Like
Covering one of the most unique set ups: Extended moves & Reversal plays
Time for a 🧵 to learn the above from @iManasArora
What qualifies for an extended move?
30-40% move in just 5-6 days is one example of extended move
How Manas used this info to book
The stock exploded & went up as much as 63% from my price.
— Manas Arora (@iManasArora) June 22, 2020
Closed my position entirely today!#BroTip pic.twitter.com/CRbQh3kvMM
Post that the plight of the
What an extended (away from averages) move looks like!!
— Manas Arora (@iManasArora) June 24, 2020
If you don't learn to sell into strength, be ready to give away the majority of your gains.#GLENMARK pic.twitter.com/5DsRTUaGO2
Example 2: Booking profits when the stock is extended from 10WMA
10WMA =
#HIKAL
— Manas Arora (@iManasArora) July 2, 2021
Closed remaining at 560
Reason: It is 40+% from 10wma. Super extended
Total revenue: 11R * 0.25 (size) = 2.75% on portfolio
Trade closed pic.twitter.com/YDDvhz8swT
Another hack to identify extended move in a stock:
Too many green days!
Read
When you see 15 green weeks in a row, that's the end of the move. *Extended*
— Manas Arora (@iManasArora) August 26, 2019
Simple price action analysis.#Seamecltd https://t.co/gR9xzgeb9K

