Categories Technicals
7 days
30 days
All time
Recent
Popular

A mega thread, this contains some of my popular threads which may help you in your trading.
Thanks for reading :)

Pyramiding
Don't change your trading
Trendlines
Scaling in-out
Thanks for reading :)
Pyramiding
A thread on Pyramiding- pic.twitter.com/8EOSSFMZ2w
— Trader knight (@Traderknight007) December 27, 2020
Don't change your trading
"Don't change the trading rules after every trade."
— Trader knight (@Traderknight007) November 29, 2020
If you do change them frequently then this thread is for you.
Let's talk about the law of large numbers and how it benefits traders to be profitable.
[Thread]\U0001f447\U0001f447\U0001f447 pic.twitter.com/pEUr0wH354
Trendlines
A thread on Trend-lines pic.twitter.com/GsLGzl8A3c
— Trader knight (@Traderknight007) January 2, 2021
Scaling in-out
A thread on SCALING IN - OUT METHOD - pic.twitter.com/bJ1N5ZjAiK
— Trader knight (@Traderknight007) January 9, 2021

Many people ask me about Relative Strength (RS) line on my chart, and its utility. So, finally I've published a script on TradingView which lets you add this indicator to your chart!
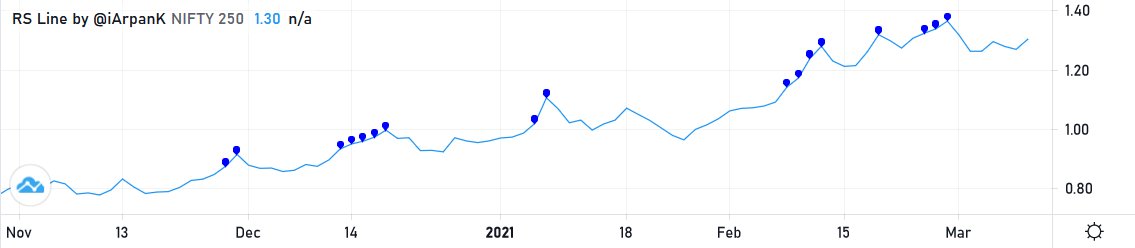
𝗥𝗲𝗹𝗮𝘁𝗶𝘃𝗲 𝗦𝘁𝗿𝗲𝗻𝗴𝘁𝗵 𝗟𝗶𝗻𝗲 𝗯𝘆 @𝗶𝗔𝗿𝗽𝗮𝗻𝗞 v1.0
Read full thread for steps
Step #1
Head to the indicators tab on top of your TradingView chart and search for the indicator name or my id - 𝗶𝗔𝗿𝗽𝗮𝗻𝗞
You'll find my indicator there.
Step #2
Click on 'Add to favorites' as shown in image below

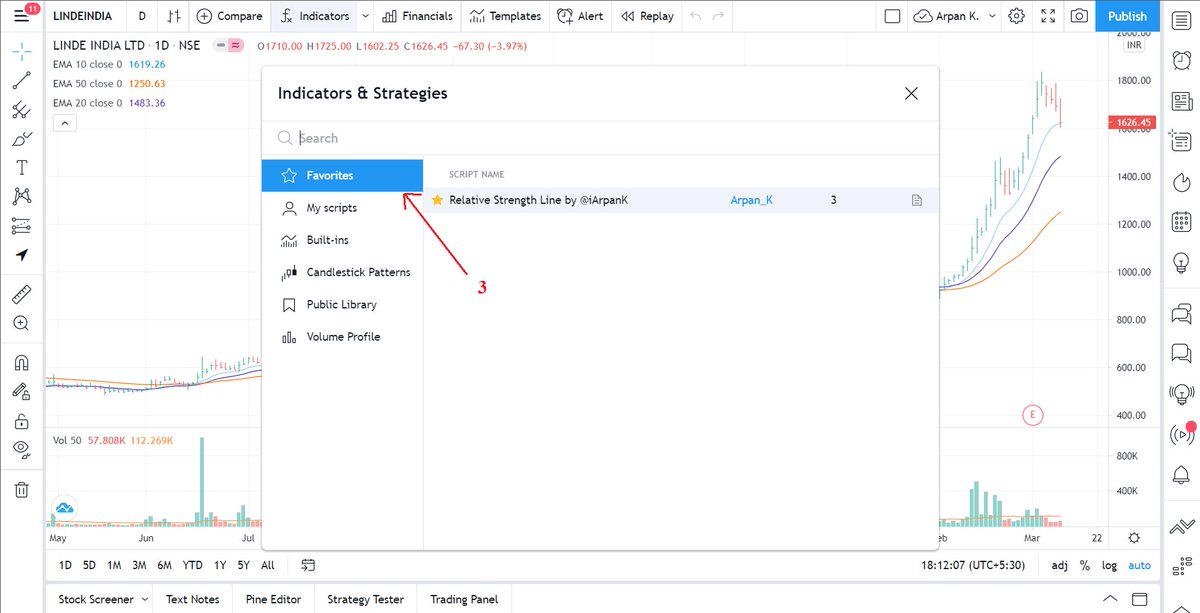
Step #3
Go to the 'Favorites' section in the same dialog box, as shown in image below.
You'll find the indicator there. Now click on it and it gets added to your chart! Now you can access this indicator anytime from Indicators -> Favorites.
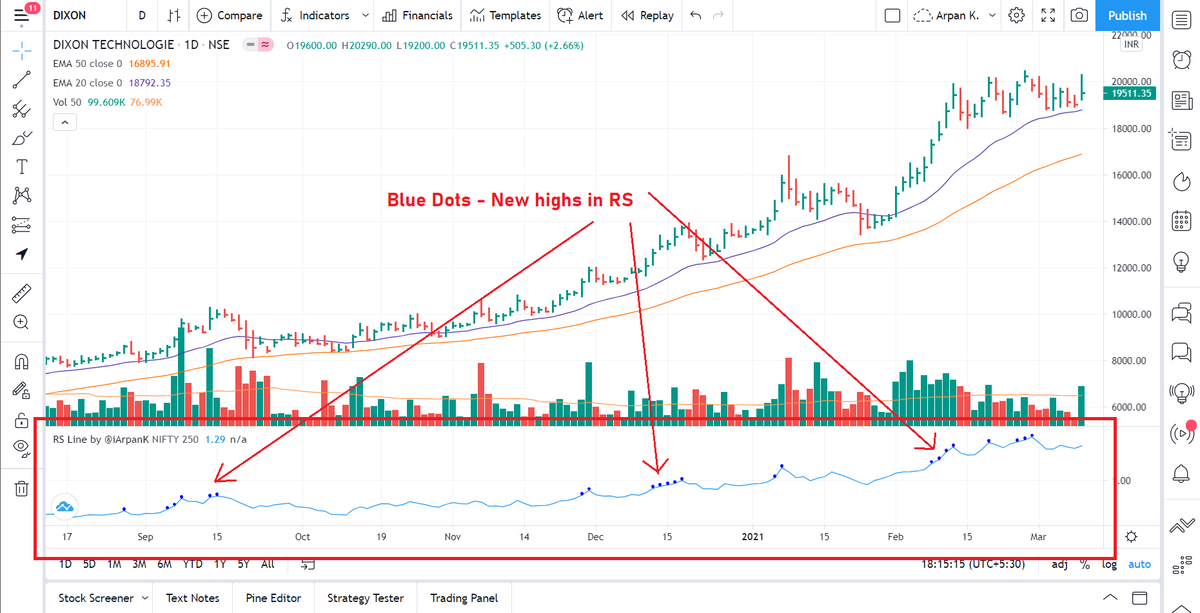
Finally, we have the RS line indicator on the bottom of the chart with blue dots denoting new highs in RS!
By default, blue dots show new 250 days high in RS (~1 year high)
But you can change the indicator period, colors, symbols by heading to the settings tab of the indicator.
You can check the full documentation of the script with complete user settings & usage details on https://t.co/3q9UOn5GF7
Use it in your day-to-day trading & let me know your experience :)
𝗥𝗲𝗹𝗮𝘁𝗶𝘃𝗲 𝗦𝘁𝗿𝗲𝗻𝗴𝘁𝗵 𝗟𝗶𝗻𝗲 𝗯𝘆 @𝗶𝗔𝗿𝗽𝗮𝗻𝗞 v1.0
Read full thread for steps
Step #1
Head to the indicators tab on top of your TradingView chart and search for the indicator name or my id - 𝗶𝗔𝗿𝗽𝗮𝗻𝗞
You'll find my indicator there.
Step #2
Click on 'Add to favorites' as shown in image below
Step #3
Go to the 'Favorites' section in the same dialog box, as shown in image below.
You'll find the indicator there. Now click on it and it gets added to your chart! Now you can access this indicator anytime from Indicators -> Favorites.
Finally, we have the RS line indicator on the bottom of the chart with blue dots denoting new highs in RS!
By default, blue dots show new 250 days high in RS (~1 year high)
But you can change the indicator period, colors, symbols by heading to the settings tab of the indicator.
You can check the full documentation of the script with complete user settings & usage details on https://t.co/3q9UOn5GF7
Use it in your day-to-day trading & let me know your experience :)