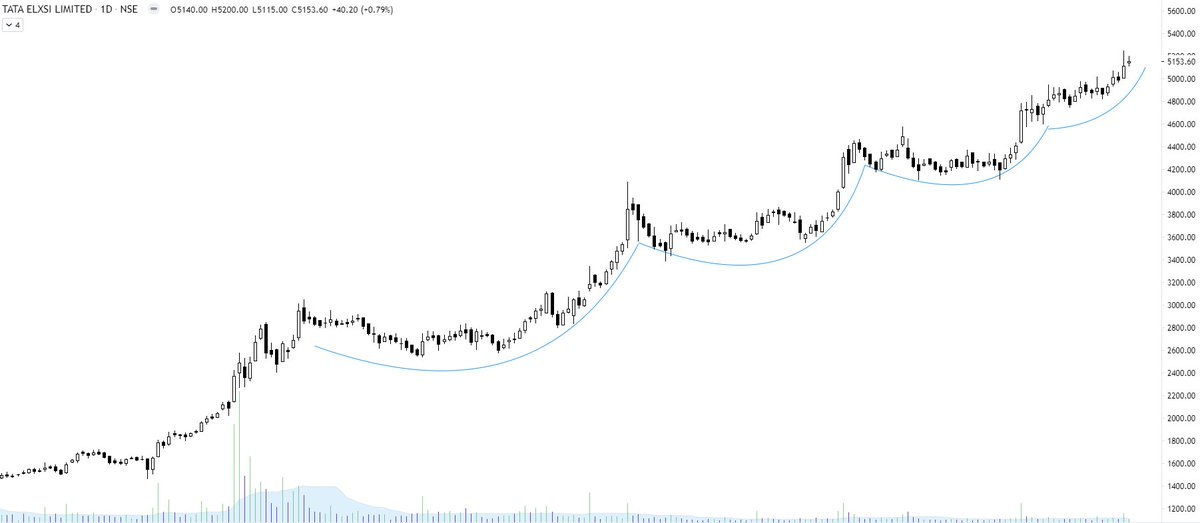
Tata Elxsi - Scallops are most common but I found them rarely in Indian stocks.
More on scallops by Thomas Bulkowski here 👇
https://t.co/DAZAWXbnJu
More from The_Chartist 📈
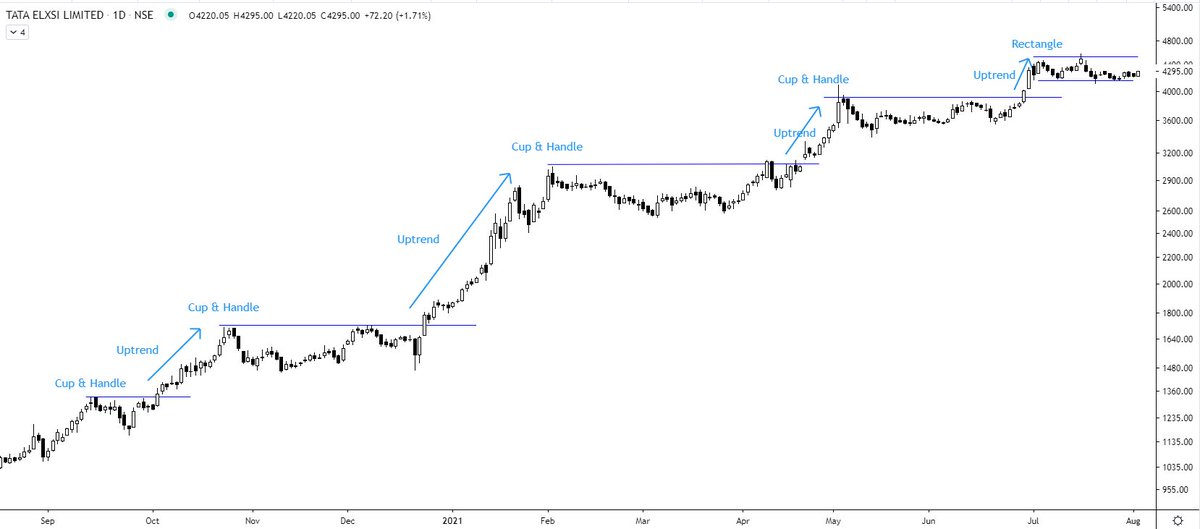
Tata Elxsi (W) - near to the resistance zone again 5th time. @nishkumar1977 @suru27 @rohanshah619 @indian_stockss @sanstocktrader @BissaGauravB @RajarshitaS @PAVLeader @Rishikesh_ADX @VijayThk @Investor_Mohit @TrendTrader85 @jitendra_stock pic.twitter.com/aIC5kO8XqA
— Steve Nison (@nison_steve) December 18, 2020
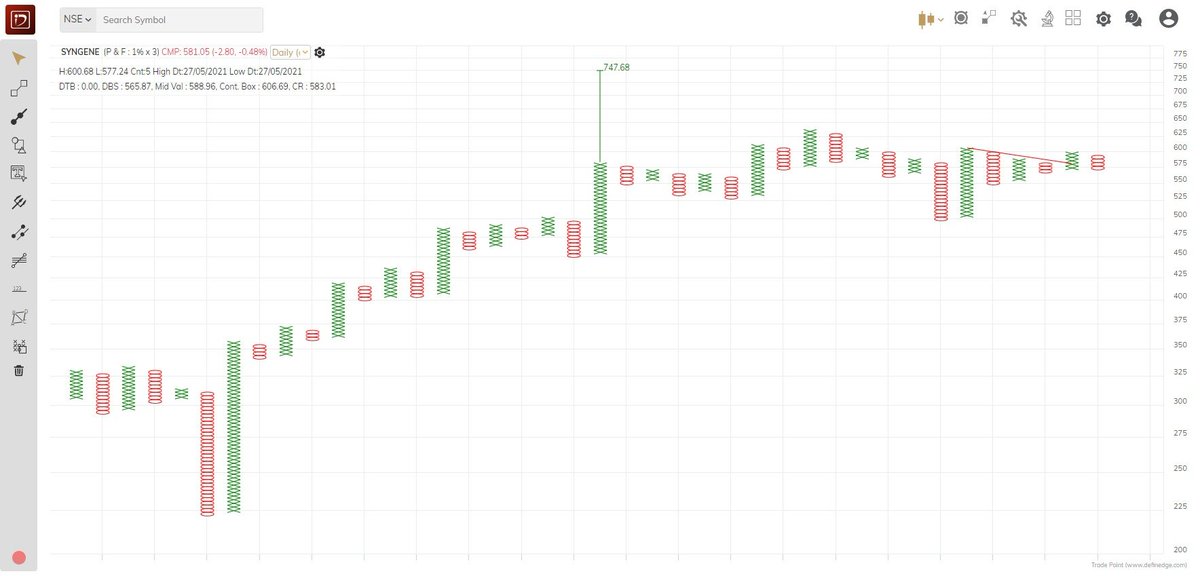
Syngene - Same concept. Price contraction. Shift from weak to strong hands through repeated volatility contractions. I can well write one whole page explanation on it. Look at the volume pump today. A big hand will never let you ride with him. Make sure you are there at the party https://t.co/RN8sQYzdBg pic.twitter.com/AShKWnQeJt
— Steve Nison (@nison_steve) July 15, 2021
although a must-have portfolio stock. Faced resistance right at the upper channel boundary. Volumes high. Any retracement back to the lower boundary will be an opportunity to accumulate. https://t.co/5uDsUXsbPP
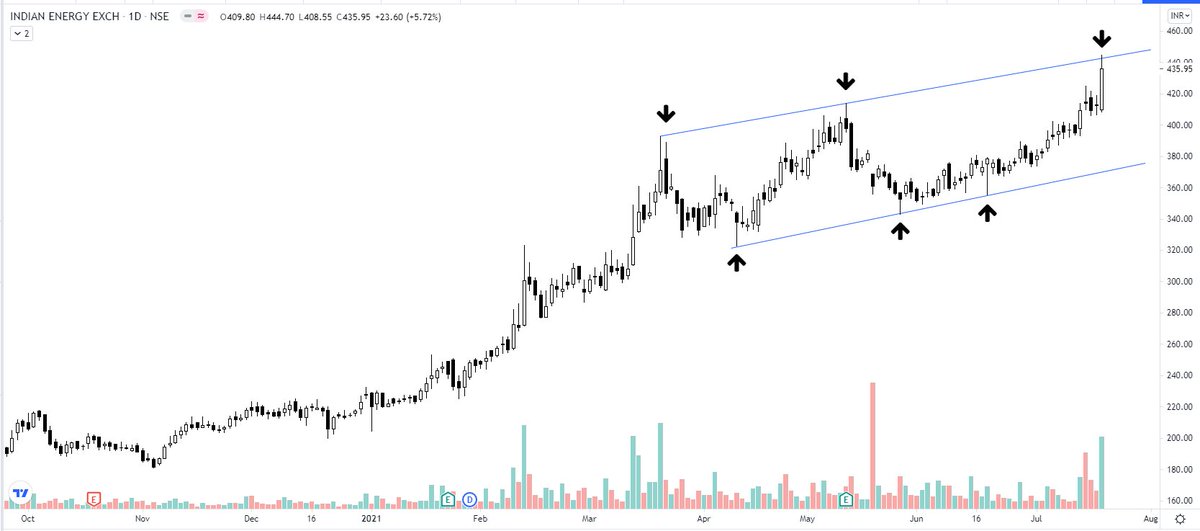
IEX - the resistance turning support. Kindly review, please. @nishkumar1977 @suru27 @rohanshah619 @indian_stockss @sanstocktrader @BissaGauravB @RajarshitaS @PAVLeader @Rishikesh_ADX @VijayThk @Investor_Mohit @TrendTrader85 pic.twitter.com/7CCzmee5If
— Steve Nison (@nison_steve) December 18, 2020
Nifty Private Bank https://t.co/BwG1DKhhLc
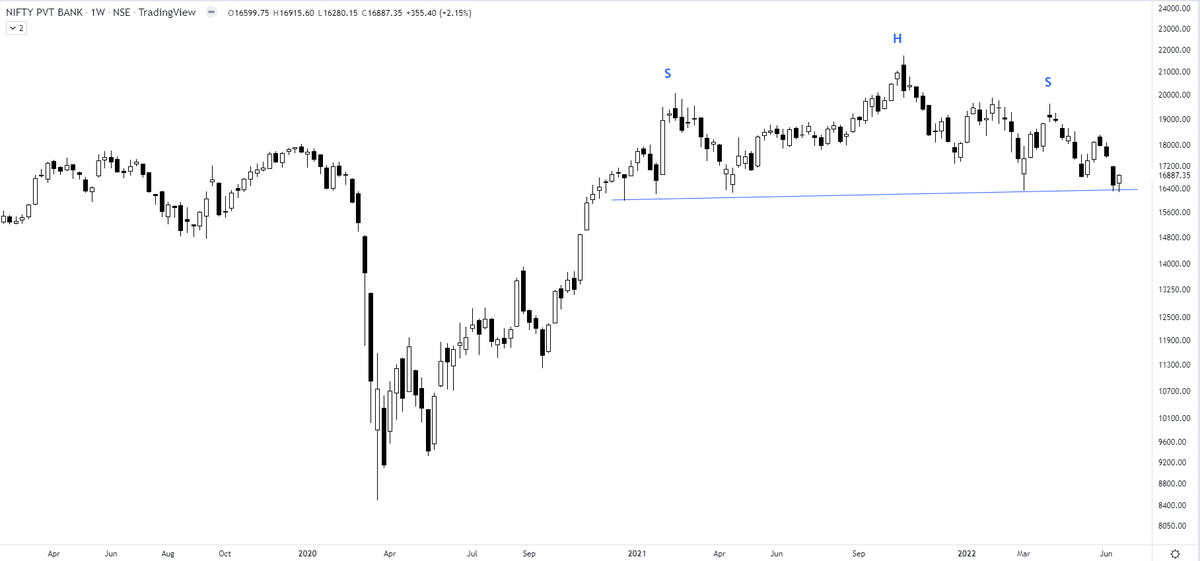
I am watching a big bearish H&S top building up in Nifty Private Bank Index. Any breakdown will result in increased volatility in respective charts. For traders - definitely not a spot to be in. The index has to move beyond 19900 to negate the pattern. pic.twitter.com/IGFeyNrtQV
— The_Chartist \U0001f4c8 (@charts_zone) June 19, 2022
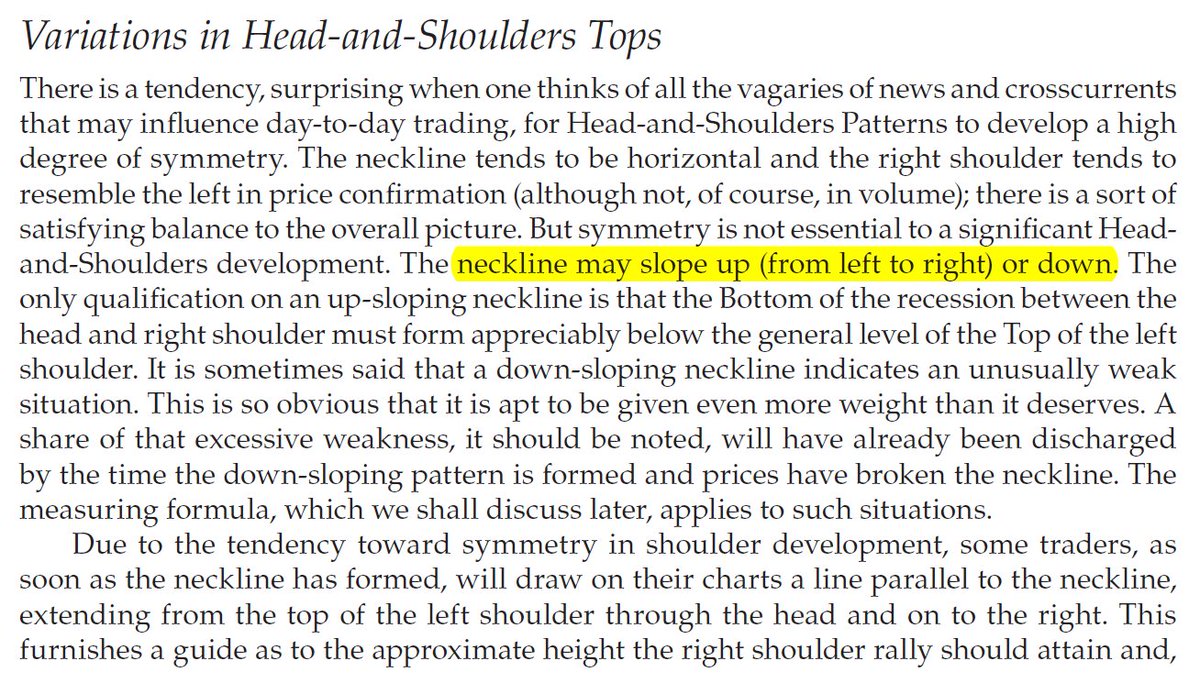
Sir Edwards & Magee discussed sloping necklines in H&S in their classical work. I am considering this breakdown by Affle as an H&S top breakdown with a target open of 770.
— The_Chartist \U0001f4c8 (@charts_zone) May 25, 2022
The target also coincides with support at the exact same level. pic.twitter.com/n84kSgkg4q
You May Also Like


For three years I have wanted to write an article on moral panics. I have collected anecdotes and similarities between today\u2019s moral panic and those of the past - particularly the Satanic Panic of the 80s.
— Ashe Schow (@AsheSchow) September 29, 2018
This is my finished product: https://t.co/otcM1uuUDk
The 3 big things that made the 1980's/early 1990's surreal for me.
1) Satanic Panic - satanism in the day cares ahhhh!
2) "Repressed memory" syndrome
3) Facilitated Communication [FC]
All 3 led to massive abuse.
"Therapists" -and I use the term to describe these quacks loosely - would hypnotize people & convince they they were 'reliving' past memories of Mom & Dad killing babies in Satanic rituals in the basement while they were growing up.
Other 'therapists' would badger kids until they invented stories about watching alligators eat babies dropped into a lake from a hot air balloon. Kids would deny anything happened for hours until the therapist 'broke through' and 'found' the 'truth'.
FC was a movement that started with the claim severely handicapped individuals were able to 'type' legible sentences & communicate if a 'helper' guided their hands over a keyboard.